Designing a battery pack for a Formula Student vehicle involves carefully selecting the appropriate battery cells based on the vehicle’s performance requirements. A key challenge in this process is accurately determining the vehicle’s energy needs, the maximum voltage selection and all the consequences of this choice on vehicle performance and efficiency.
Energy requirement
The key aspect of designing a battery pack is determining the total energy needed to complete the most demanding event—the endurance race. This involves calculating the vehicle's actual kinetic energy using available endurance data, along with estimating the overall power losses in the system.
Power losses types:
- Powertrain losses
- Aerodynamic losses
- Rolling resistance losses
Although these losses may not be measured with high accuracy, even rough estimates can offer meaningful insights and are far more useful than having no data at all.
Maximum Voltage Level Selection
One of the first considerations when selecting the optimal voltage level for your battery pack is that higher voltage results in lower current for the same power output. This allows for more favorable tradeoffs in powertrain design. However, increasing the voltage introduces challenges such as Electromagnetic Interference (EMI) and greater insulation requirements.
Therefore, choosing the optimal voltage level involves balancing multiple design considerations, including:
- Motor’s performance and efficiency
- Power losses
- Voltage Dips
- DC-link Capacitors dimensioning
Motor’s performance and efficiency
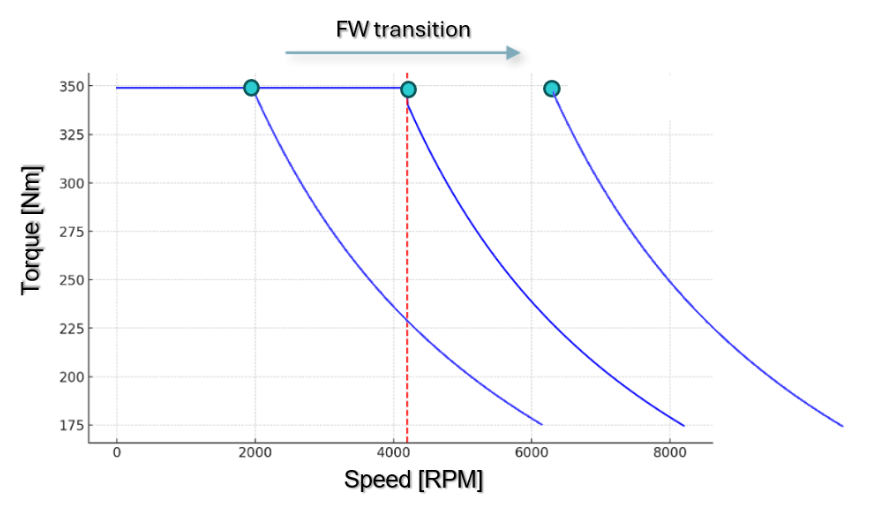
The most common option for EV motors in Formula Student are PMSMs. The rotor of the PMSM generates a constant magnetic field so while it spins, a voltage—known as back Electromotive Force (back-EMF)—is induced in the stator windings. This back-EMF increases with the motor's angular speed. At a certain speed, the back-EMF equals the voltage applied to the motor by the inverter. This point is known as the base speed and beyond this speed, Field Weakening techniques must be employed to allow further acceleration.
This phenomenon highlights that the motor’s torque–speed characteristic is directly influenced by the inverter’s maximum phase voltage, which in turn depends on the battery pack voltage. The diagram below illustrates how increasing the battery voltage shifts the base speed to the right, allowing the motor to maintain constant torque over a wider speed range. You can also visit the following link for more information about motor performance and simulations.
Kia EV9: A quick look into the Dual Inverter Strategy with PSIM
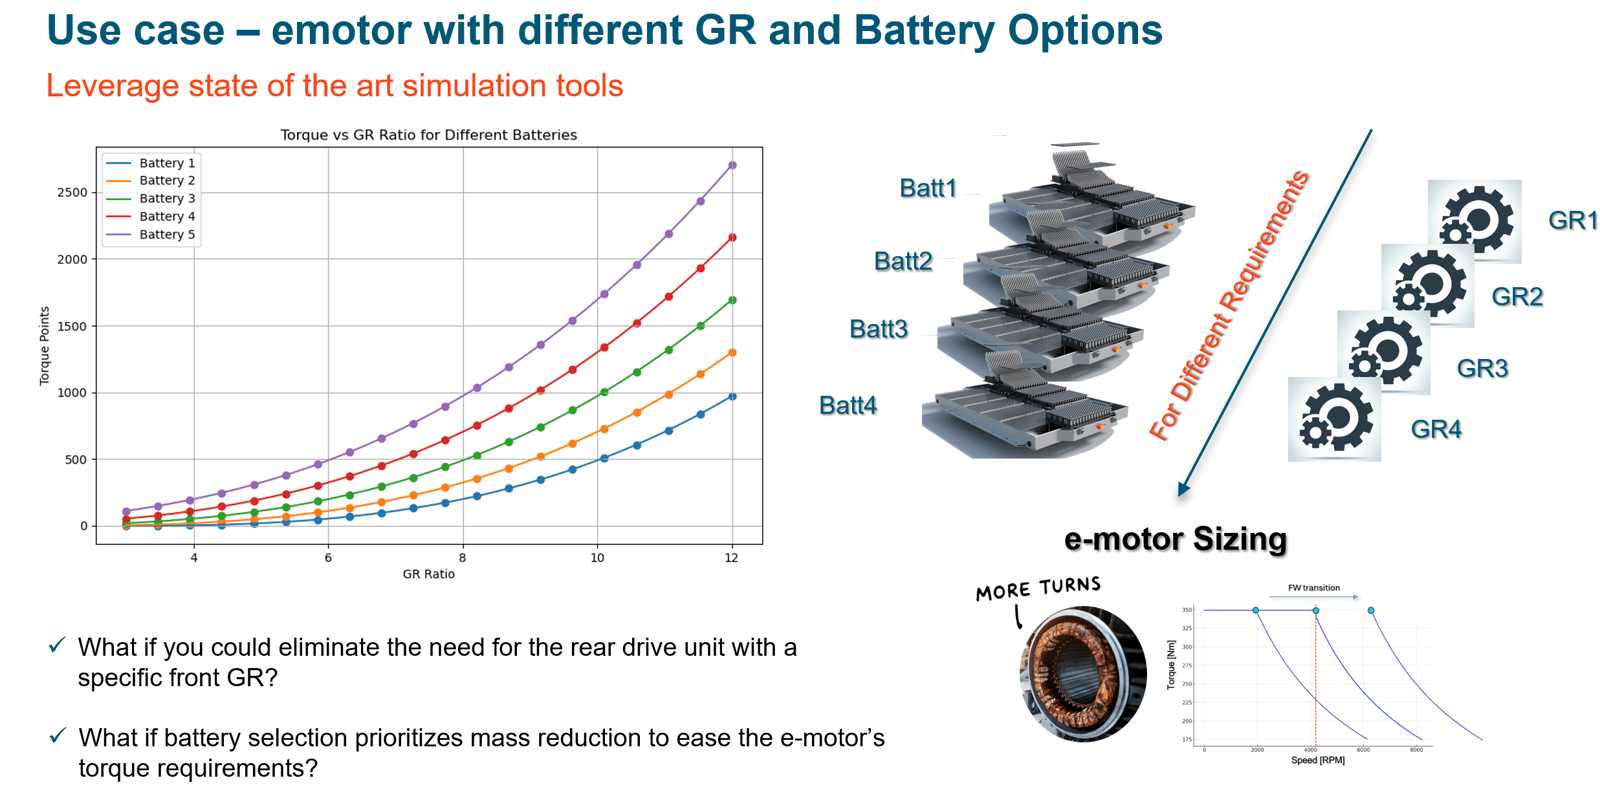
Although the battery pack voltage does not necessarily need to be set at the maximum allowed by the FSAE regulations, the overall powertrain must still be capable of meeting the required torque and speed demands. The gear ratio selection is also involved here. So, we talk about a multi tradeoff optimization problem
Cables Power Losses
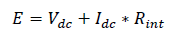
The FSG rules explicitly state that the maximum power output from the Tractive System Accumulator Container is limited to 80 kW. According to the equation

for a given power demand from the motors, a higher battery voltage results in lower current. This means that by operating closer to the maximum permissible voltage, it is possible to reduce the current flowing through the cables, thereby allowing for thinner and lighter cables and busbars without increasing power losses. Moreover, DC link capacitors are allowed to be smaller as ripple current is going to be decreased.
Voltage Dips – Battery Internal Resistance
Every battery cell includes an internal resistance which is influenced by the State of Charge (SOC), Temperature and State of Health. However we can assume that the resistance is a constant number. The power losses that this resistance consume are
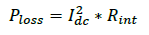
That means that we want this resistance to be as small as possible to limit the battery cell’s thermal losses
Another significant reason that indicates that the internal resistance should be as small as possible is shown at the picture below.
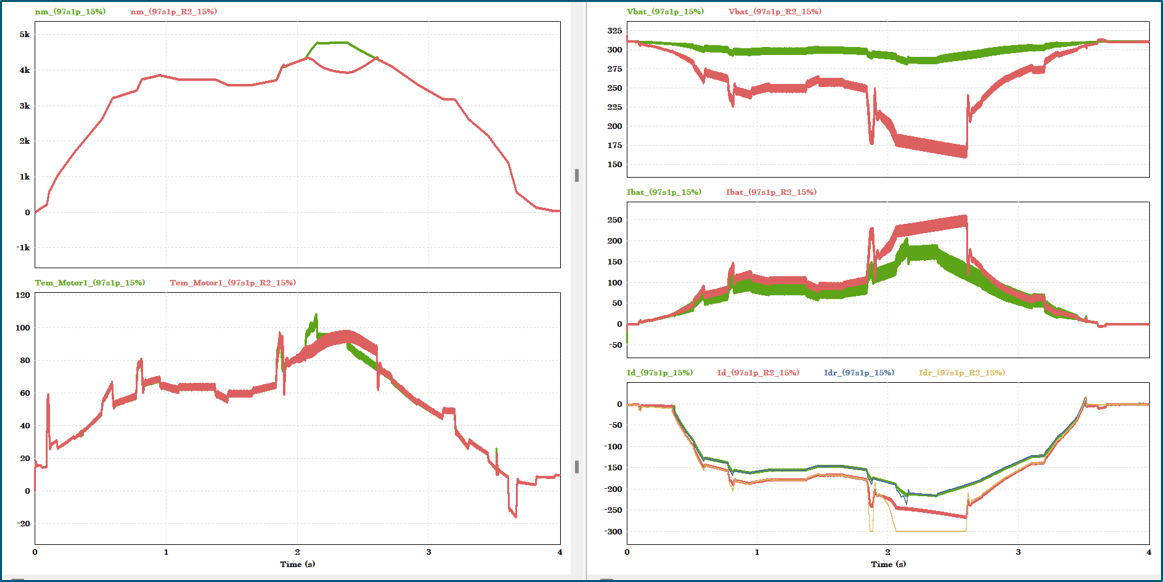
In the upper-right graph, the output voltage of two different battery packs is shown, while the vehicle’s speed is presented in the upper-left curve. When current is drawn, a higher internal resistance (red curve) results in a greater voltage drop, which in turn limits the vehicle to lower speeds, especially in low SOC conditions
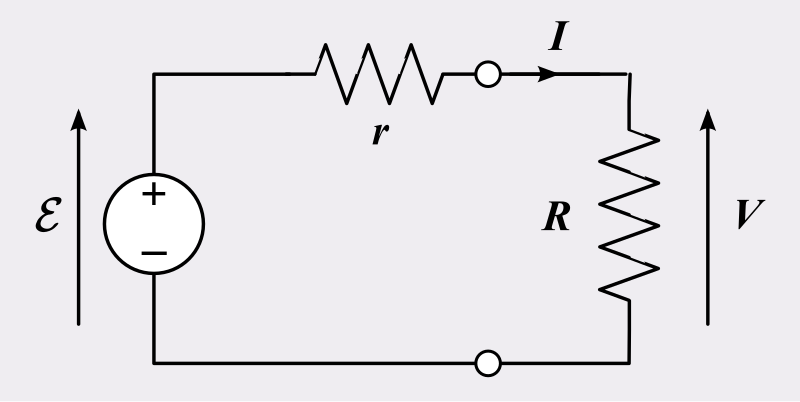
This is explained by the following equation:
The voltage drop is affected by both the current and the internal resistance. As illustrated in the figure, the curve with higher internal resistance reaches the cut-off voltage threshold more quickly.
This implies that, without proper battery pack balancing, the BMS may cut off power prematurely—before the segment is fully discharged. This issue is particularly pronounced in systems where balancing is based on terminal voltage rather than SoC estimation, making ESR a critical factor.
Altair Software Workflow
Now that we understand the key aspects involved in optimizing a battery pack, the next step is finding an efficient and practical solution. This is where Altair’s software comes in, offering a streamlined workflow that simplifies the process while ensuring accuracy and precision.
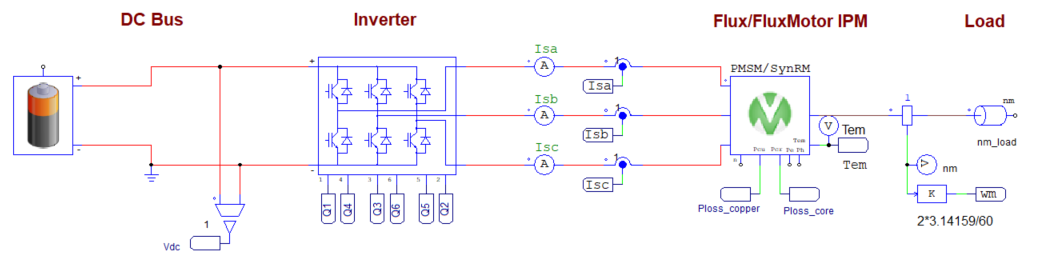
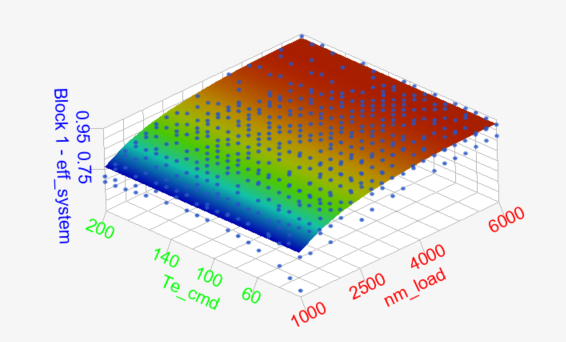
Efficiency map creation – PSIM
As previously discussed, one category of power losses is powertrain losses. PSIM helps calculate these losses from the battery to the motor. Furthermore, PSIM can easily be connected to Flux, Altair's motor design solution. This workflow is the only one in the market that allows you to connect a ROM and FEA design inside the 1D system tool and include motor’s copper and core losses.
The following video may be helpful about how you can couple Flux with PSIM.
If you haven’t worked with efficiency maps or learned how to create them, the following link points to a webinar that can be very insightful
Fast Track eDrive Efficiency Maps & WLTP drive cycle with PSIM
Moreover, if you have not experimented with Hyperstudy before, it's recommended to start by reading the following article.
Automating PSIM with Hyperstudy vs Scripting
Endurance cycle - Twin Activate
After generating the powertrain efficiency map, the next step is to perform an endurance simulation in the Twin Activate environment. This allows you to calculate the remaining power losses using previously collected endurance speed data.
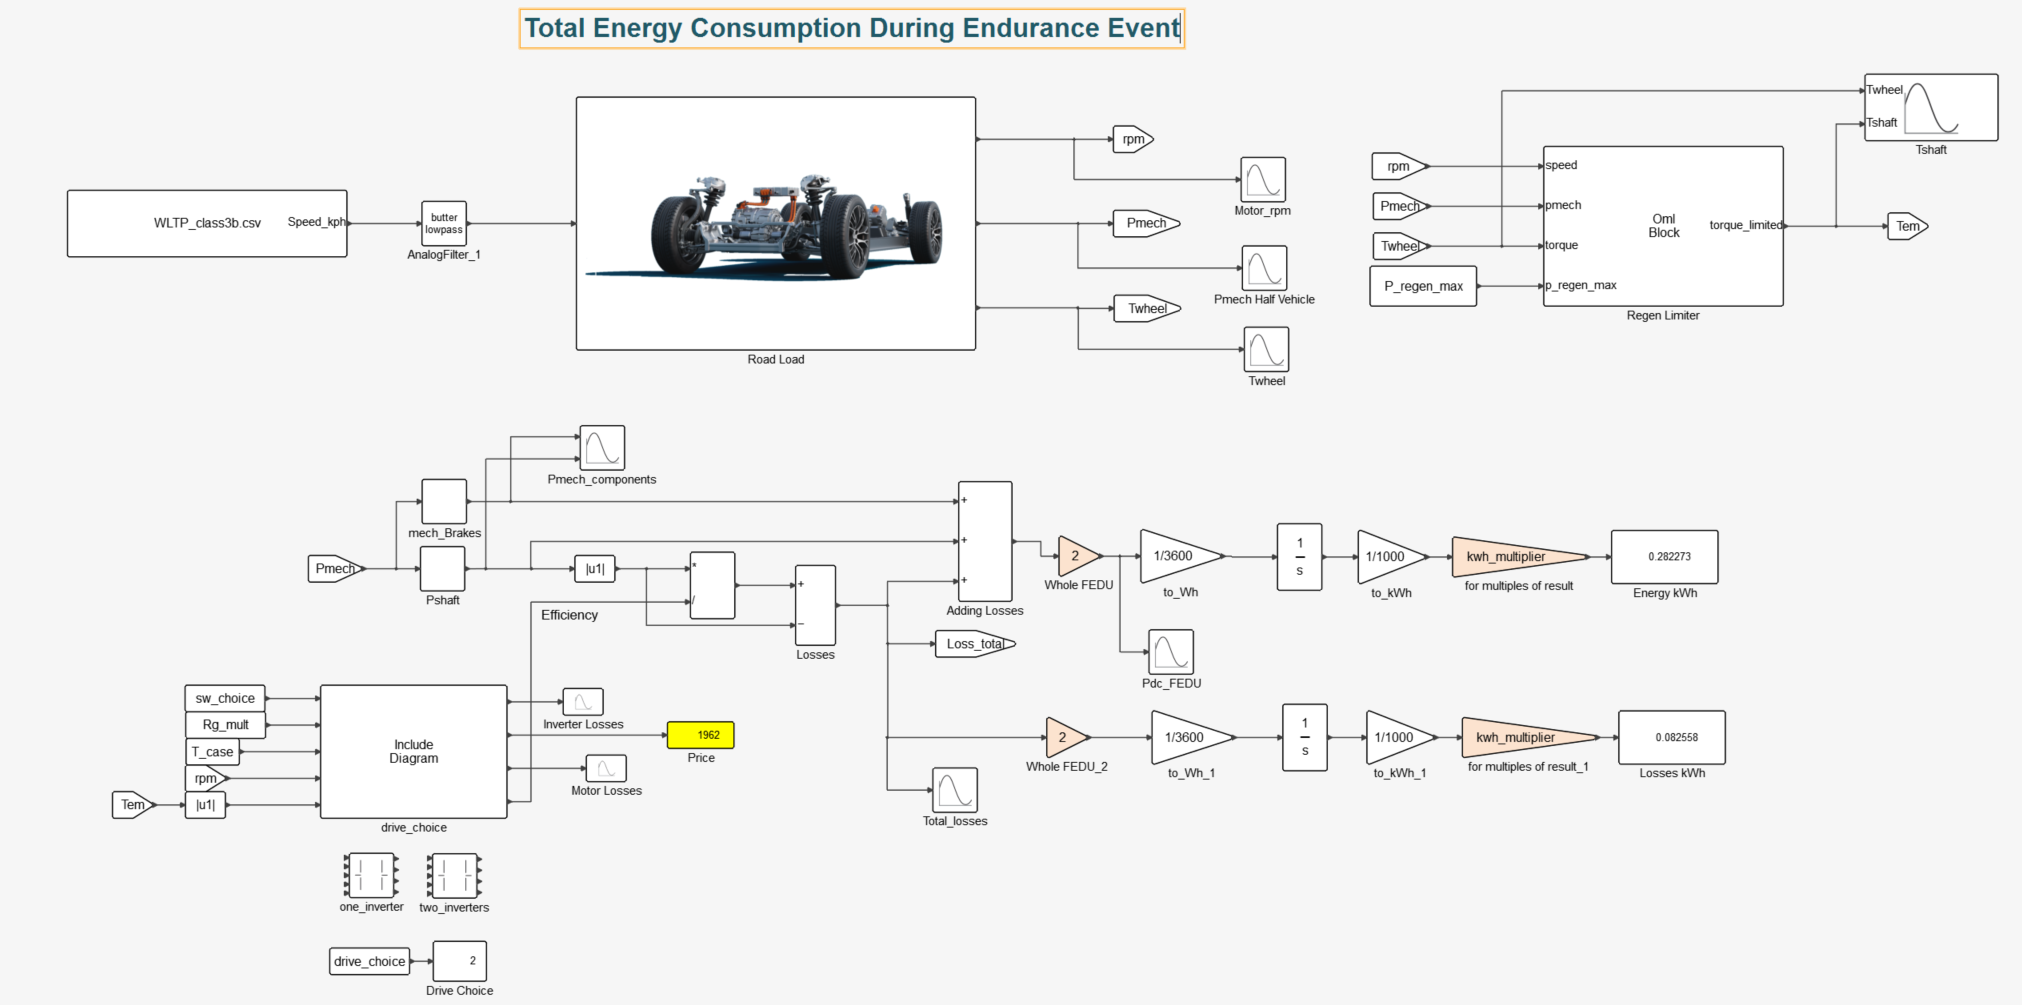
Once this simulation is completed, you'll be able to estimate the vehicle’s energy requirements. The accuracy of this calculation depends heavily on how precisely the model parameters are defined—the more accurate the inputs, the more reliable the results.
You can find more information about Drive Cycles and simulation files as getting started examples at the following links
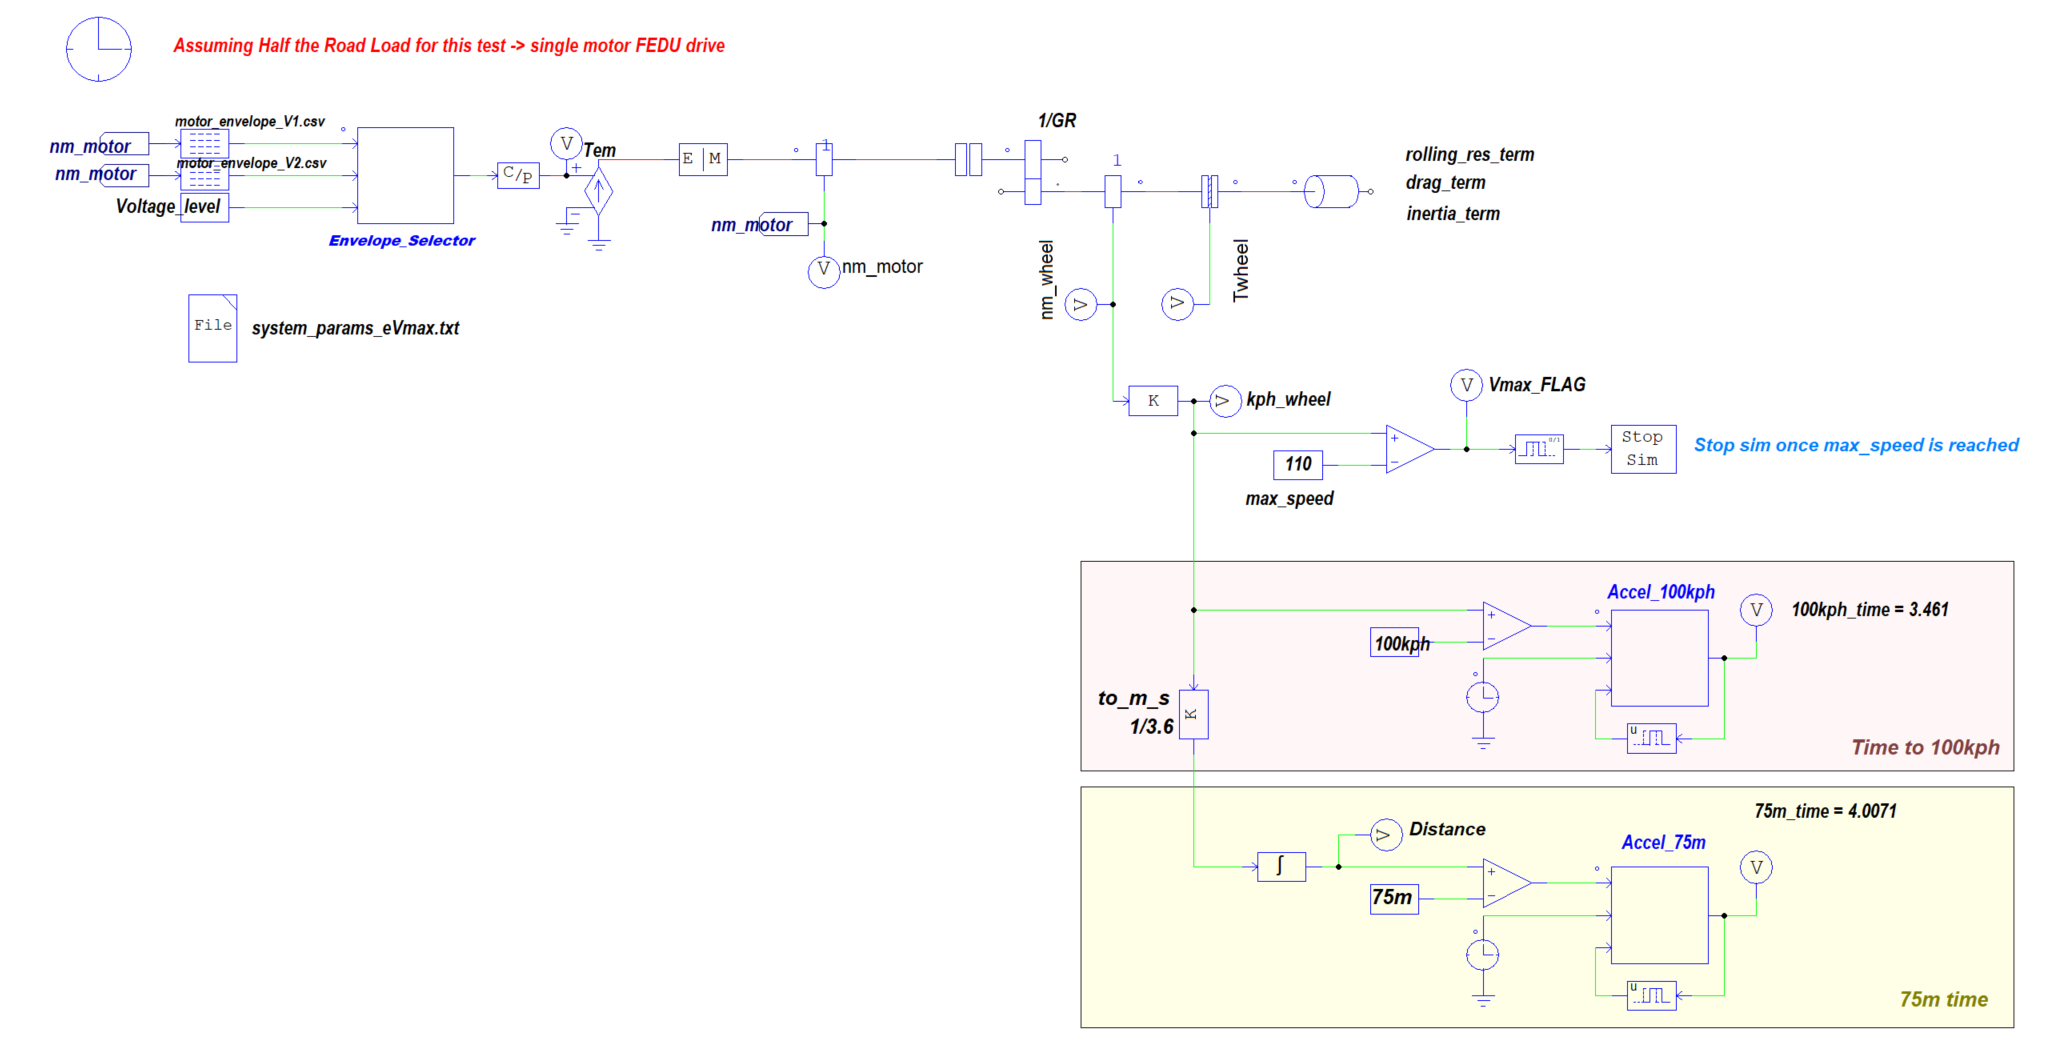
Acceleration cycle - PSIM
Acceleration performance is influenced by the powertrain, including battery pack and gear ratio selection. The following link contains an acceleration simulation in PSIM, which can be used as a base model for your system.
EV Acceleration Performance at Wide Open Throttle (WOT) Using PSIM
Market Search – Hyperstudy analysis
When selecting a battery cell to purchase, all relevant factors must be carefully considered. Manufacturers offer a wide variety of battery cell models, making the selection process complex.
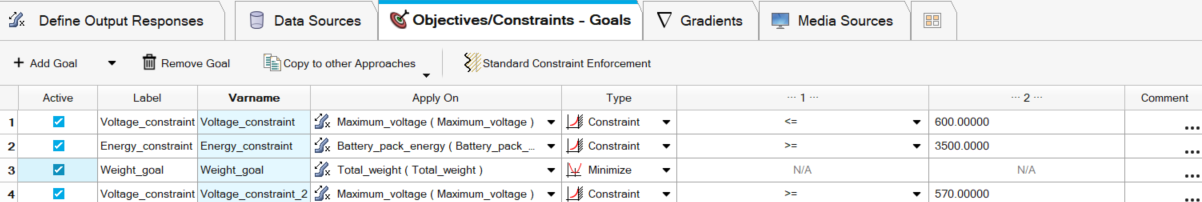
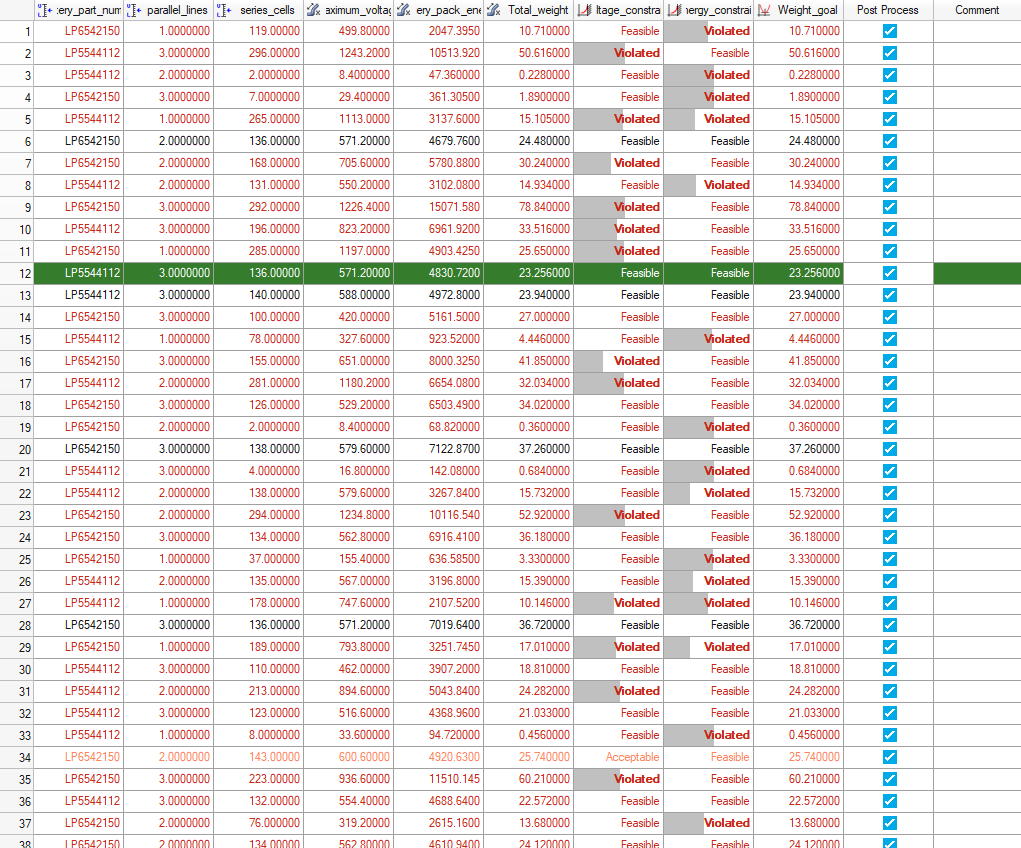
HyperStudy, a powerful mathematical optimization tool, can assist by identifying battery models that satisfy defined constraints—such as efficiency or maximum voltage—while simultaneously optimizing other parameters, such as weight.
So, you can find a HyperStudy analysis in the attached files, in which a .csv file is imported as a lookup table model containing all possible battery cell choices.
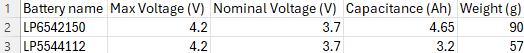
The voltage and energy constraints should be set according to the requirements assumed in the above simulations.
In our example, we compared two battery cells and determined which one to use, as well as how many cells should be connected in series and in parallel, in order to minimize battery pack's weight
Uploaded files: