In metal plasticity, typically only the deviatoric stress is the cause of yielding. Plotting the yield surface in principal stress space, will result in a cylinder whose axis is the hydrostatic pressure line. This indicates that yielding is independent of the hydrostatic stress state, which means that we could have infinite hydrostatic compression with no yielding occurring. On the other hand, rock plasticity theories also use a similar concept except that the requirement of pressure-dependence of the yield surface demands a relaxation of the above assumption.
For materials, like soils and rocks, the frictional and dilatational effects are significant. The plastic behavior depends on the hydrostatic pressure as the internal friction is proportional to the normal force. Two commonly used yield surfaces/failure criteria are the Mohr-Coulomb model and the Drucker-Prager model.
In Optistruct, Mohr Coulomb and Drucker Prager Plasticity is currently supported only for Solid elements in Implicit analysis (NLSTAT/NLTRAN for SMDISP/LGDISP).
1.Mohr Coulomb Plasticity
Theory
Coulomb's theory is a mathematical framework that characterizes the behavior of brittle materials, such as concrete, soil, rocks under shear and normal stress conditions. Typically, it is relevant for materials where the compressive strength significantly surpasses the tensile strength.
The Mohr-Coulomb criterion posits that failure takes place when the shear stress at any point within a material attains a value that is linearly related to the normal stress acting on the same plane. This model relies on the graphical representation of Mohr's circle, which illustrates the stress states at failure corresponding to the maximum and minimum principal stresses. The failure line is defined as the optimal straight line that tangentially intersects these Mohr's circles.
Plastic yielding begins when, on a plane in the body, the shearing stress, τ, and the normal stress, σ_n , reach the critical combination:
Where c is cohesion and ϕ is friction angle.

Mohr Coulomb Plasticity in principal stress space:

Yield Criteria: f=σ_1-σ_3+(σ_1+σ_3 ) sinϕ-2c cosϕ≤0
Flow rule: g=σ_1-σ_3+(σ_1+σ_3 ) *sinφ
Where, σ_1 and σ_3 are the maximum and the minimum principal stress of a stress state, c is cohesion, ϕ is friction angle, φ is dilatancy angle.
Dilatancy angle φ represents the ratio of plastic volume change over plastic shear strain.
When ϕ=φ, it is associative flow, otherwise, it is non-associate flow
When ϕ= 0.0, it becomes Tresca Plasticity
Optistruct Set Up
Using MAT1+MATS1 with the Optional continuation line “MC” for Mohr-Coulomb plasticity model:

Where:
‘MC’: FLAG for Mohr Coulomb plasticity
COHE: Cohesion
FRICA: Friction Angle (No default (Real >= 0.0 and =< 89.9))
DILA: Dilatancy Angle (Default = blank = FRICA (Real >= 0.0 and =< FRICA))
2.Drucker Prager
Theory
Drucker-Prager plasticity model is suitable for confined concrete, rock, soil that has the following characteristics: pressure dependence, path dependence, non-associative flow rule, work or strain hardening, and limited tensile strength. In a plasticity model, the parameters related to friction angle and cohesion affect the hardening and yielding criteria, while the parameter related to plastic dilation determines the flow rule.
Drucker-Prager yield criterion uses a modified von Mises yield criteria to incorporate the effects of pressure for massive structures.
Linear Drucker-Prager law:
For Linear Drucker-Prager, when the yield surface is plotted in principal stress space, it would resemble a cone. This indicates that if there is hydrostatic tension, the yield strength would get smaller and if hydrostatic compression increases, the yield strength would get bigger.

The yielding function for the DP model is in the form of:
f=q+p tanβ-d≤0
Where, q and p are von-Mises stress and mean stress of a stress state, respectively. And β and d are friction angle and cohesive, respectively. (These material constants are provided by the user).
The angle of internal friction β describes the slope of the yield surface. If β=0, this would imply no dependence on hydrostatic pressure – effectively, this would change the behavior to the Mises yield surface.
The flow rule of the DP plasticity follows the form of:
g=q+p tanφ
Where, φ is the dilatancy angle (The dilatancy angle φ describes the flow potential).
If β=φ, the flow is associative.
If φ=0, no inelastic volumetric strains will be produced.

Yield Criteria in p-q plane
Optistruct Set Up
Optional continuation lines for Linear Drucker-Prager plasticity model (only for Implicit analysis)

Where:
‘LDP’: FLAG for Linear Drucker Prager model
TYPE: type of YIELD
= ‘COMP’, compression yield stress
= ‘TENS’, tension yield stress
= ‘COHE’, cohesion
YIELD: initial yield stress (or d)
FRICA: Friction Angle β (No default (Real >= 0.0 and =< 89.9))
DILA: Dilatancy Angle φ (Default = blank = FRICA (Real >= 0.0 and =< FRICA))
When TYPE = ‘COMP’, users need to provide σ_c0 in YIELD field, and OS converts σ_c0 to cohesion d by: d=(1-1/3 tanβ ) σ_c0
When TYPE = ‘TENS’, users need to provide σ_t0 in YIELD field, and OS converts σ_t0 to cohesion d by: d=(1+1/3 tanβ ) σ_t0
When TYPE = ‘COHE’, users provide d in YIELD field, and OS use it directly without conversion
Material constants conversion between MC and DP:
In plane strain condition, the material constants from Mohr-Coulomb model can be converted to Drucker-Prager model by the following formulation:

3.Optistruct Example - Bearing Capacity of Soil

The soil model will be 5m wide, 5m long and 0.1m thick.
The footing an area equal to A_xz= 0.5x0.1=0.05 m^2.
Enforced Displacement of -0.005 m for the footing nodes. (the nodes at the area of the footing are connected via MPC)

Arc-Length method is used NLPCI (NLCTRL or NLPARM continuation line):

Example 1- Mohr Coulomb: MC_model.fem
Material Set -Up:
In MAT1 we define the Young’s Modulus to be equal to 10^10 Pa, poisson’s ratio as 0.49.
In MATS1 material card we activate the MC continuation line, and we define cohesion equal to 490000 Pa and friction angle as 20deg. Since we leave dilatancy angle as default it’s value will be equal to the friction angle (associative flow rule).


Example 2- Drucker Prager: DP_model.fem
The parameters for Drucker Prager Plasticity are calculated using the following equations, since we enforced plane strain condition:

Material Set -Up:

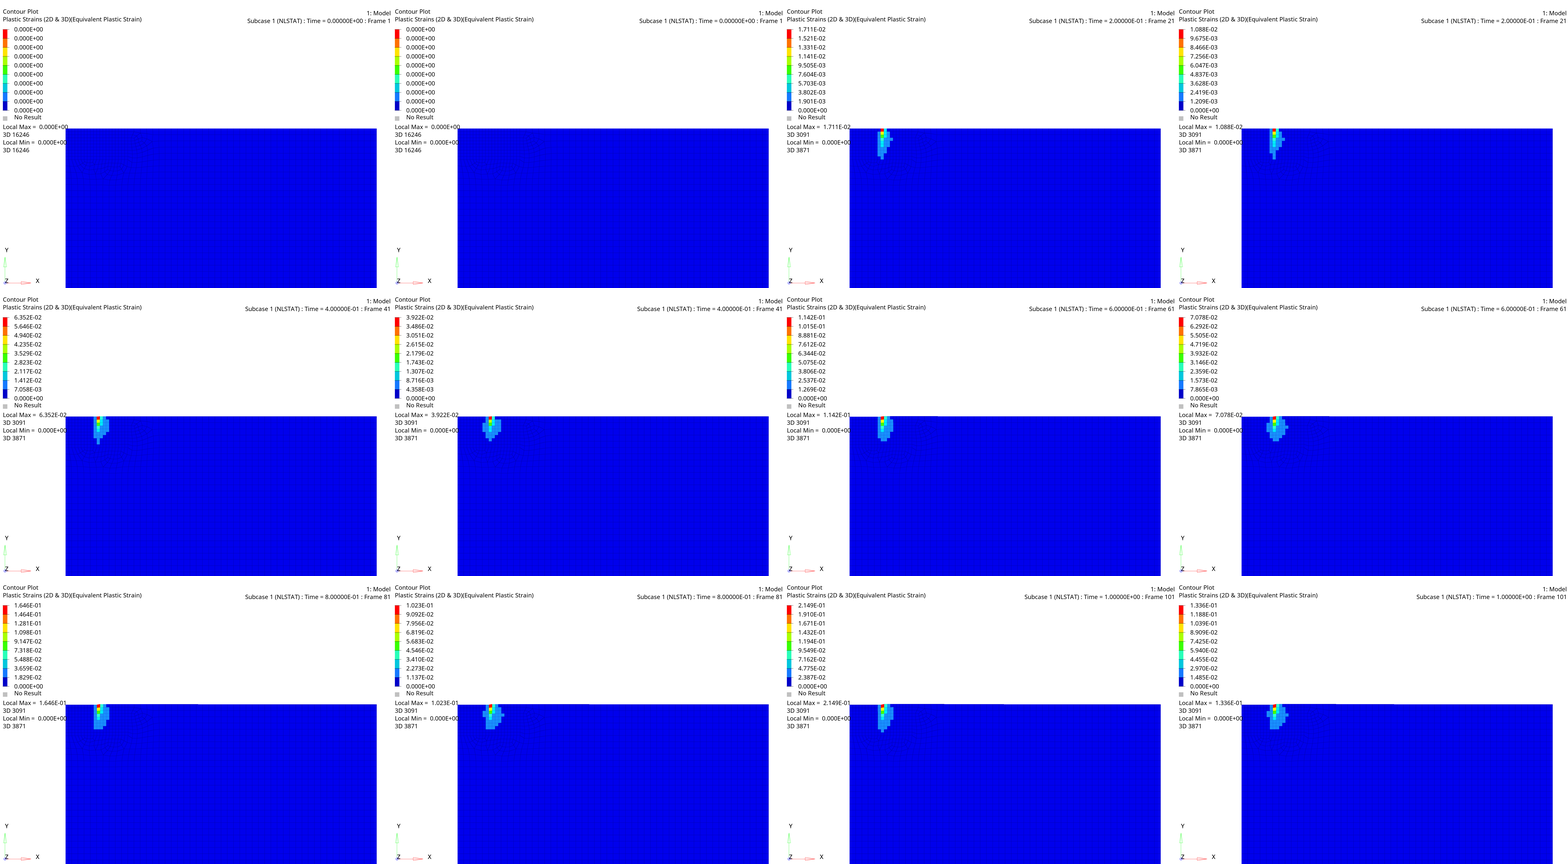
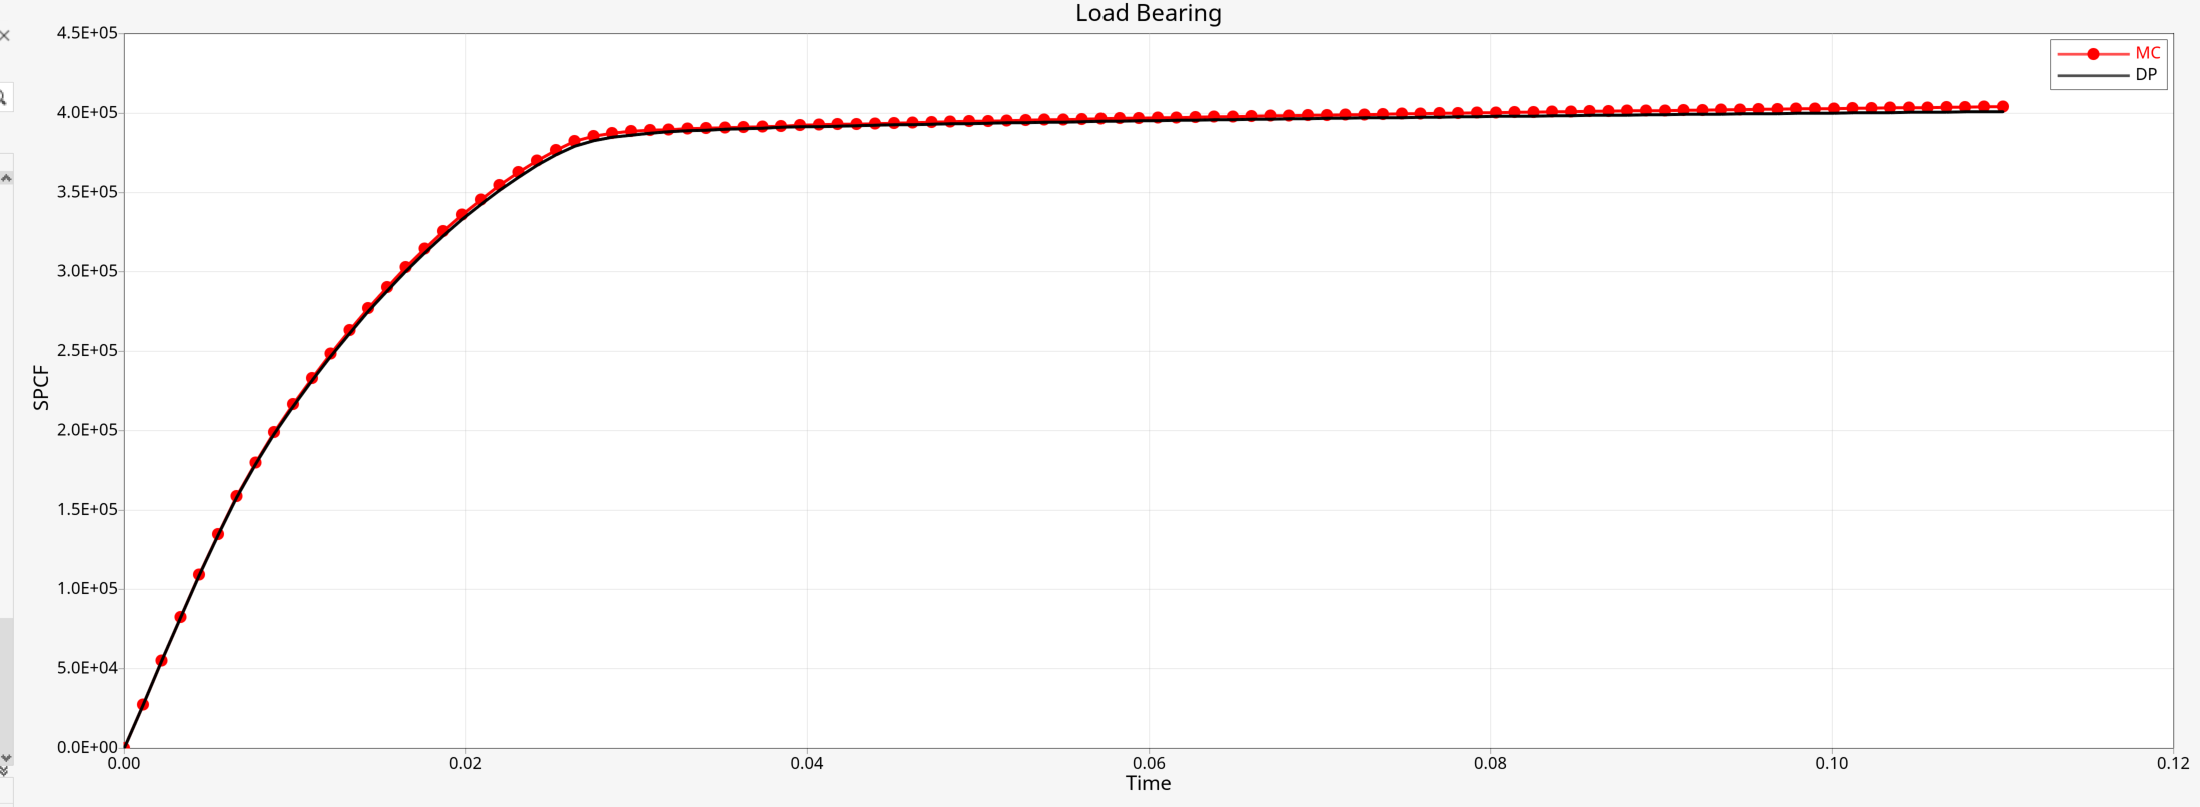
Comparison of the two Plasticity Models:


Equivalent plastic strain can be requested via STRAIN(PLASTIC) = ALL


Load Bearing Curve (SPCF-y vs DISP-y)
!Tip:
To plot the above curve in HyperView + Hypergraph:
In HV select the nodes of the footing and plot Displacement and SPC forces in y direction.

In HG select all curves containing the displacements and right click, Multiple Curves Math, Add, to summate the results in a single curve. Then, repeat the same for the curves with the SPCF results.

Go to Define, click on “+” sign to add a new curve, select as source Math and Expression Builder as Curves. Then select the y axis values of the Summated Displacement curve, as X component in the vectors and the y axis values of the Summated SPCF curve, as Y component in the vectors.
