Introduction
Efficiency map generation is common with PSIM, with users worldwide leveraging its speed and robustness to automate power electronics simulations and achieve consistent, reliable results.
This webinar walks you through the process of generating an efficiency map for a motor drive using PSIM and HyperStudy:
Fast-Track eDrive Efficiency Maps in PSIM | Webinar June 2025
HyperStudy is Altair's code-free simulation automation and optimization solution. It's benefits over traditional scripting methods are covered here:
Automating PSIM with HyperStudy vs Scripting
Using Python
For users who don’t yet have access to HyperStudy, Python offers an accessible way of automating PSIM. A Python script is provided with this article to support this process and automatically generate valid torque-speed operating points—using just a screenshot of your machine’s torque-speed envelope.
Step 1
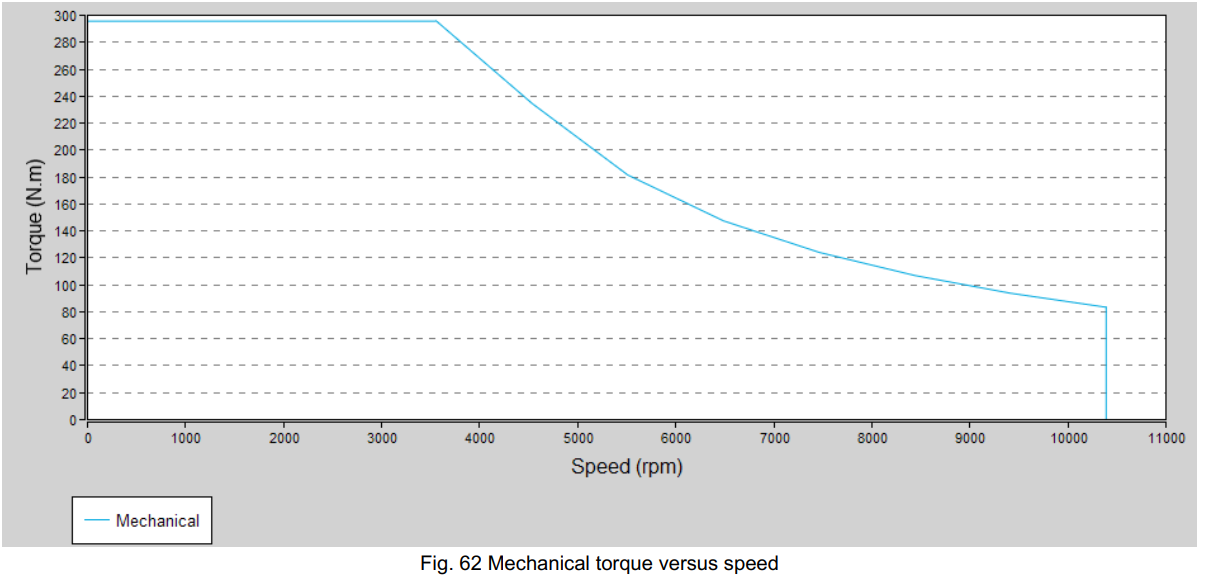
Take a screenshot of your machine's torque-speed envelope of your machine.
In this case we will use the Nissan Leaf-like PMSM found in FluxMotor's catalog:
Step 2
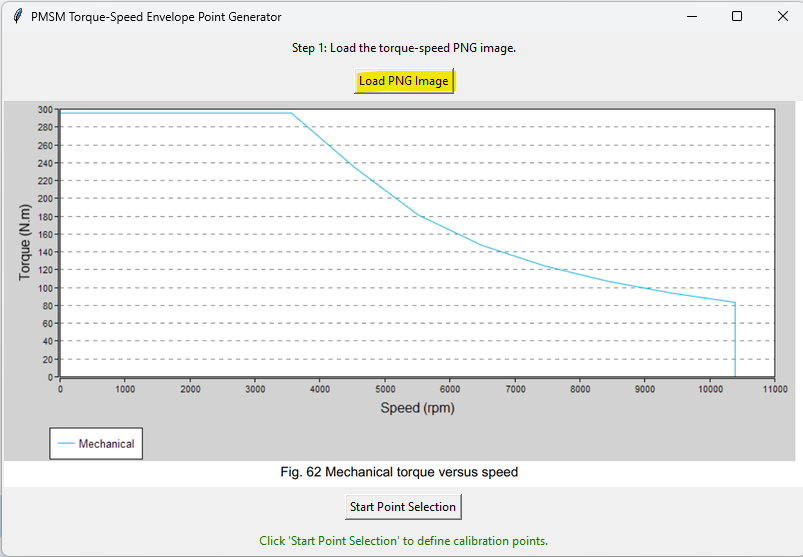
Use the following script, to load the torque-speed envelope screenshot and generate valid points:
Click "Load PNG Image" to load the screenshot:
Step 3
Click "Start Point Selection" and then click exactly 2 RED calibration points:
- Top-left of the axis (maximum torque, zero speed)
- Bottom-right of the axis-not torque at max speed (zero torque, maximum speed)
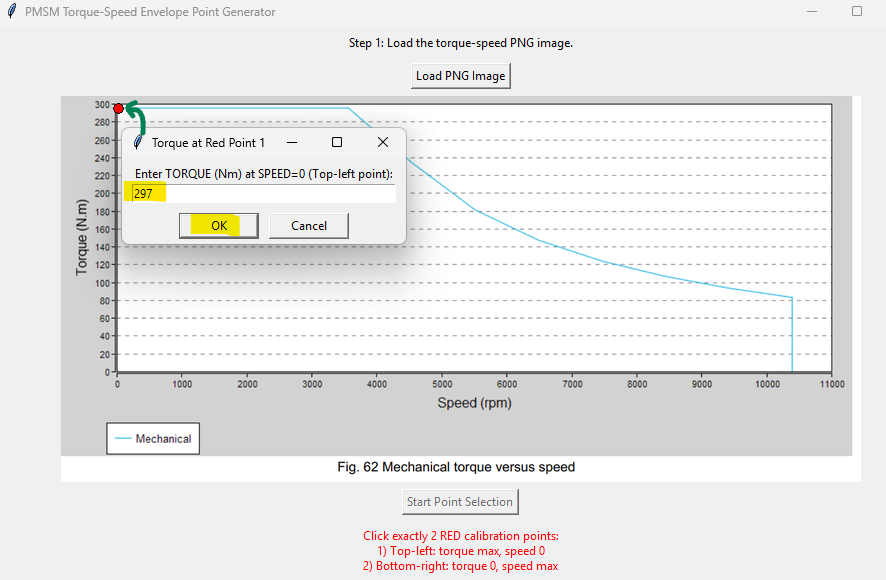
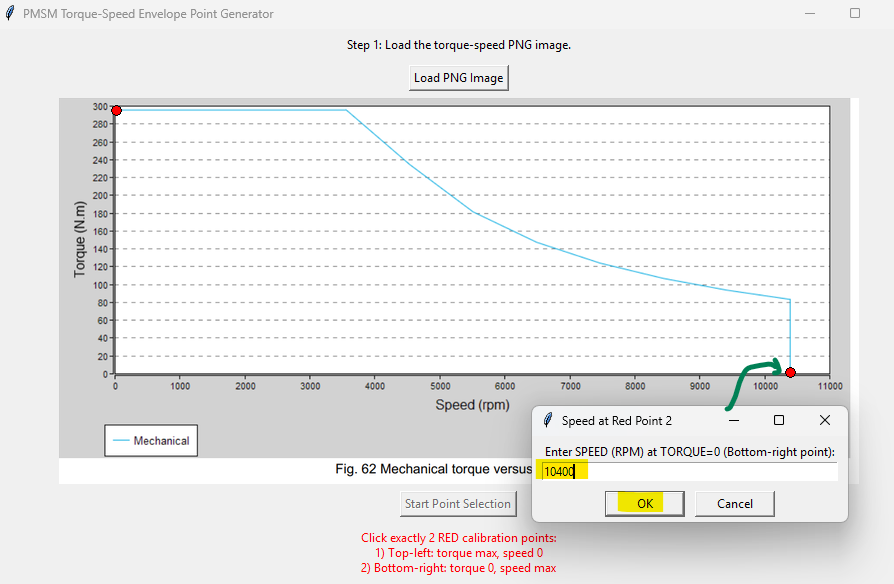
This will calibrate the image limits.
Step 4
Click exactly 15 BLUE envelope limit points around the torque-speed limit curve and the defining x-y axes.
Start with the top-left red point position and go around the envelope:
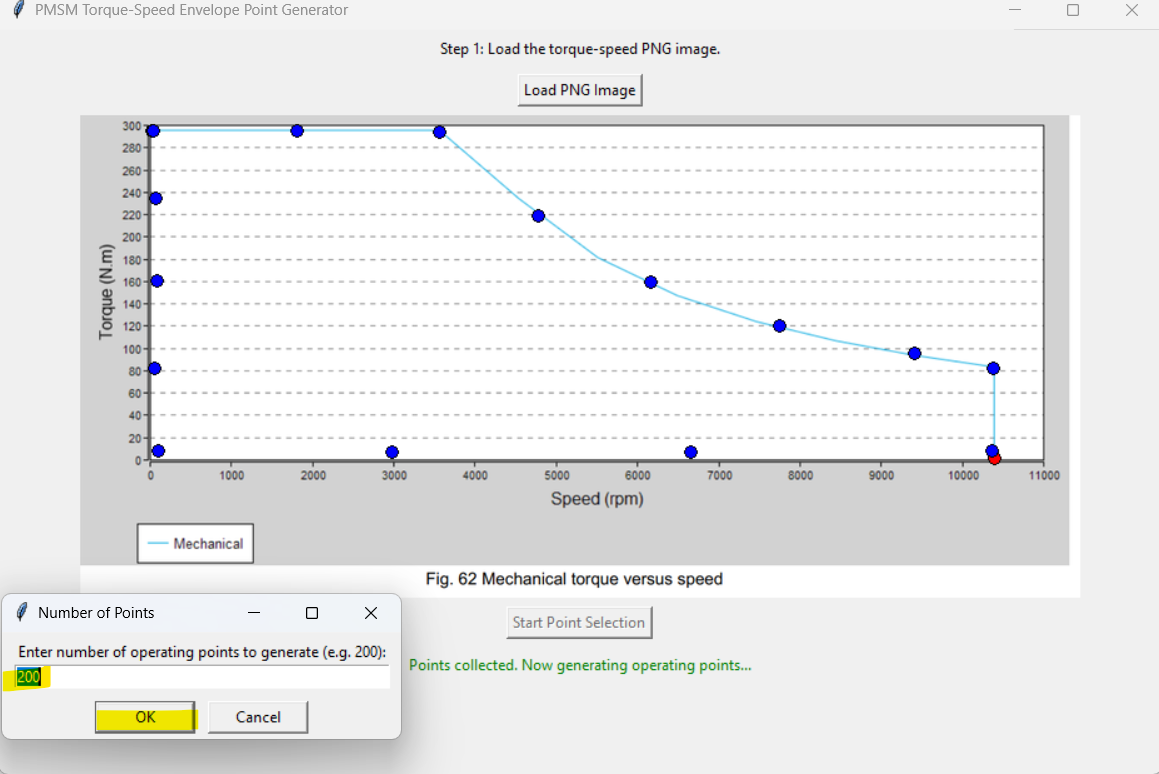
Also define the number of operating points that you want to evenly distribute around the envelope (e.g. 200).
Note: We aim for 200 points in this case, but some may fall outside the valid range. It’s normal to end up with fewer—say 150. The script will tell you how many made the cut. If you want more, just tweak the point count until enough land within the envelope.
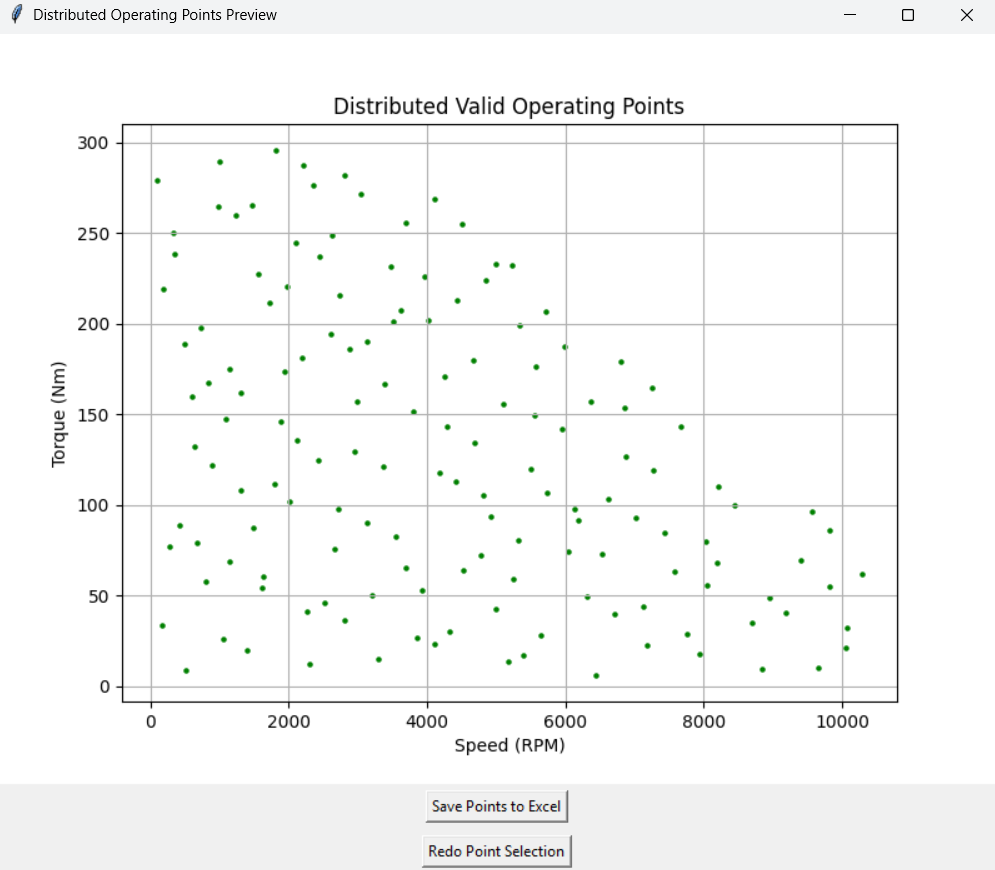
That said, the generated points will appear in a separate window, and you will have the option to redo the point selection with new limits if you are not satisfied or save the points to an Excel file.
Note: the blue points definition determines the min/max torque/speed that will be tested. For example, if you want to start evaluating from 500 rpm onward, place the vertical blue points accordingly—starting just after the 500 rpm mark.
Step 5
The generated Excel file will contain valid operating points of the torque-speed envelope (the motor should be able to hit those in PSIM with proper control). The 1st column contains the "Speed" and the 2nd column the "Torque" information.
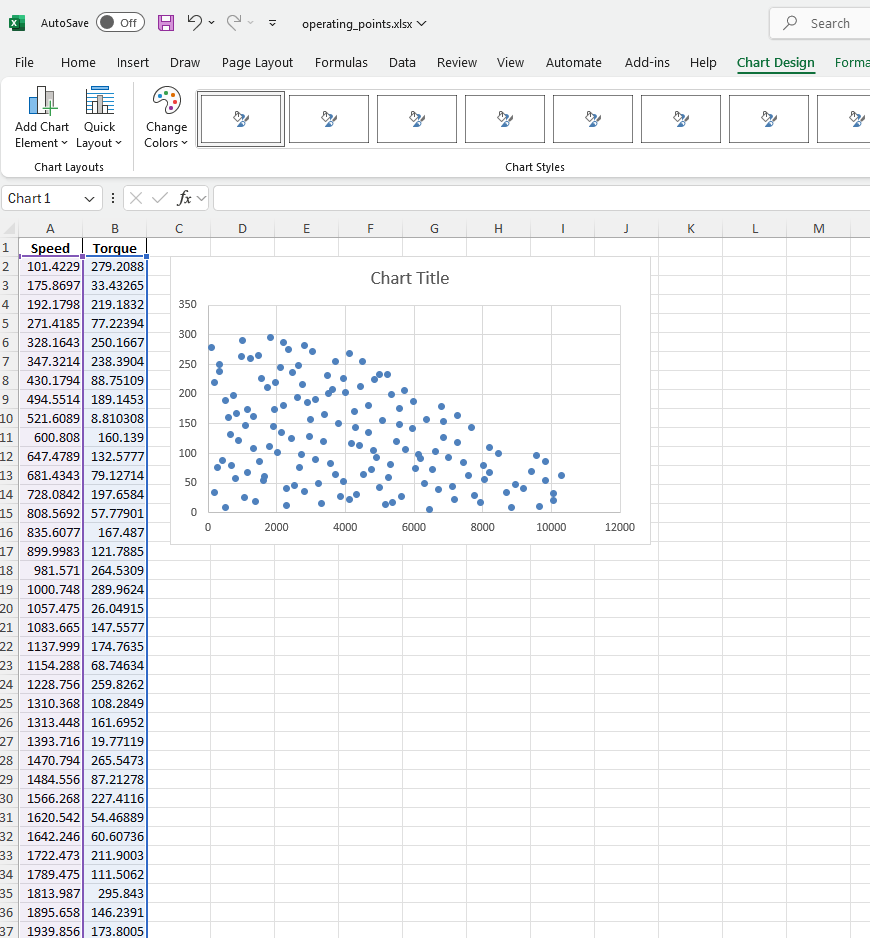
You can then load this Excel file into a Python script that calls PSIM simulations in parallel to calculate system-level efficiency for each point and generate the eff.map.
PSIM simulation using Python
Relevant Links