In this article we will explain how to set up the optimization of Kp (Proportional Gain) and Ti (Time constant) for average current control of Buck Converter with PSIM and HyperStudy.
PSIM Set-up
The PSIM schematic is composed of three main parts as shown in Fig1:
- Buck converter with Ideal switching devices:
- PI Controller with PWM generator:
The PI Controller Block has been parametrized for the proportional gain (Kp) and Time constant (Ti) using a parameter file.
- Steady-state monitoring block
This block monitors every simulation and raises the flag if steady state reached.
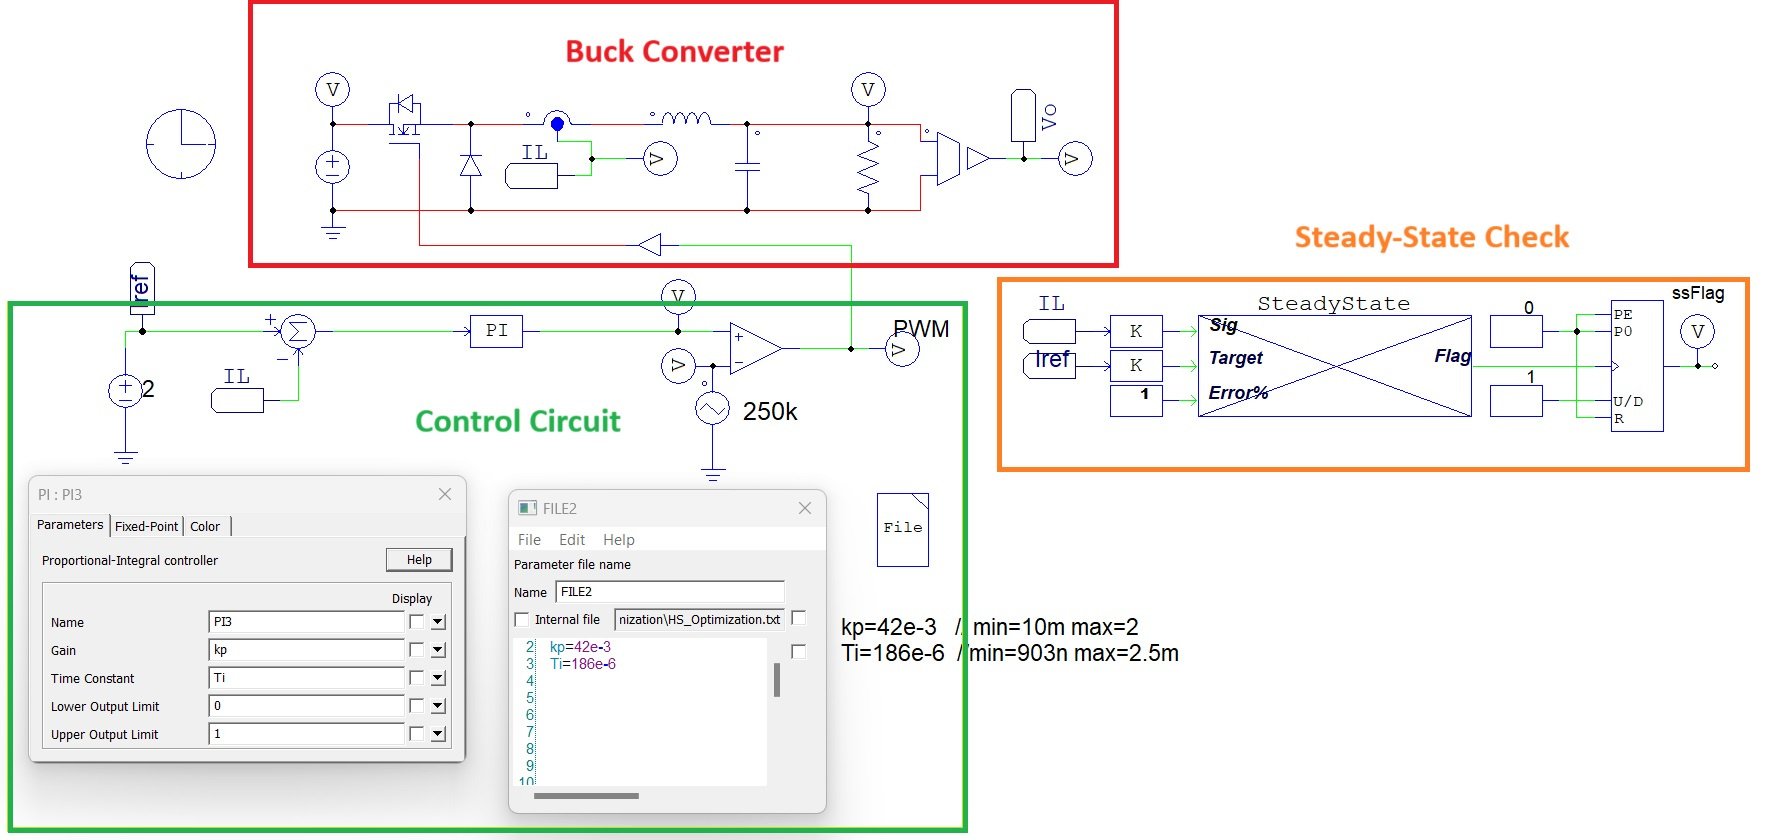
Fig1: PSIM Schematic
HyperStudy Optimization Setup
Step1: Add a PSIM model to a new study and import the input variables.
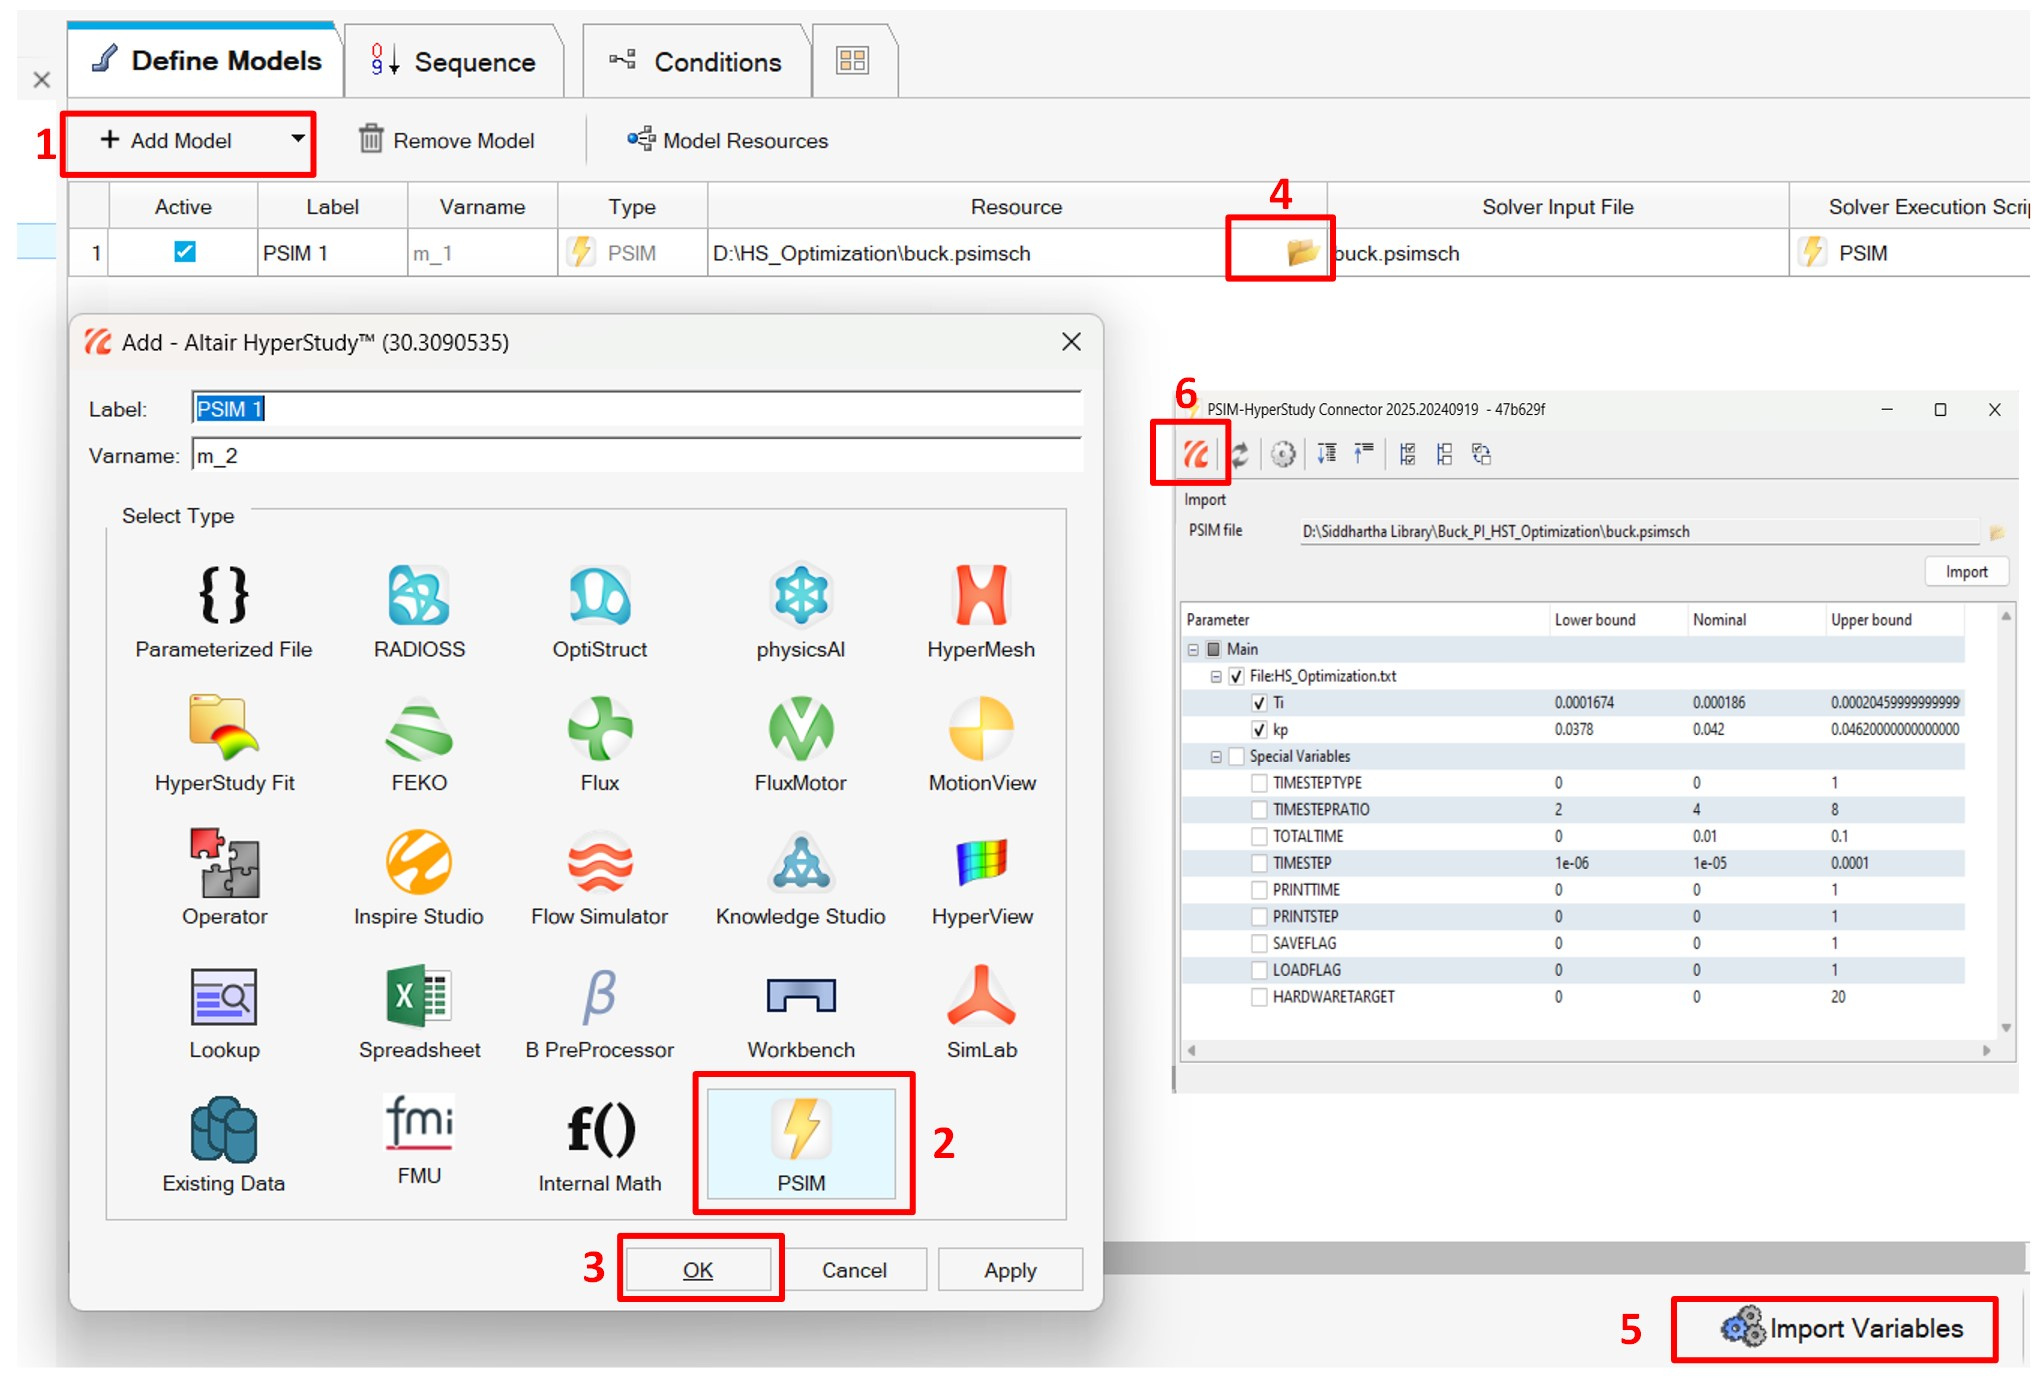
Fig2: First step in HyperStudy set-up
Step2:
Then, we need to define the bounds for the input variables.
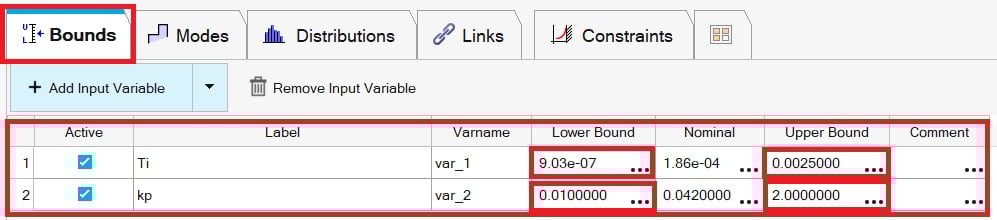
Fig3: Changing the bounds of Input Variables
Step3:
Executing the Test Model and perform the extraction of Data sources from the output file.
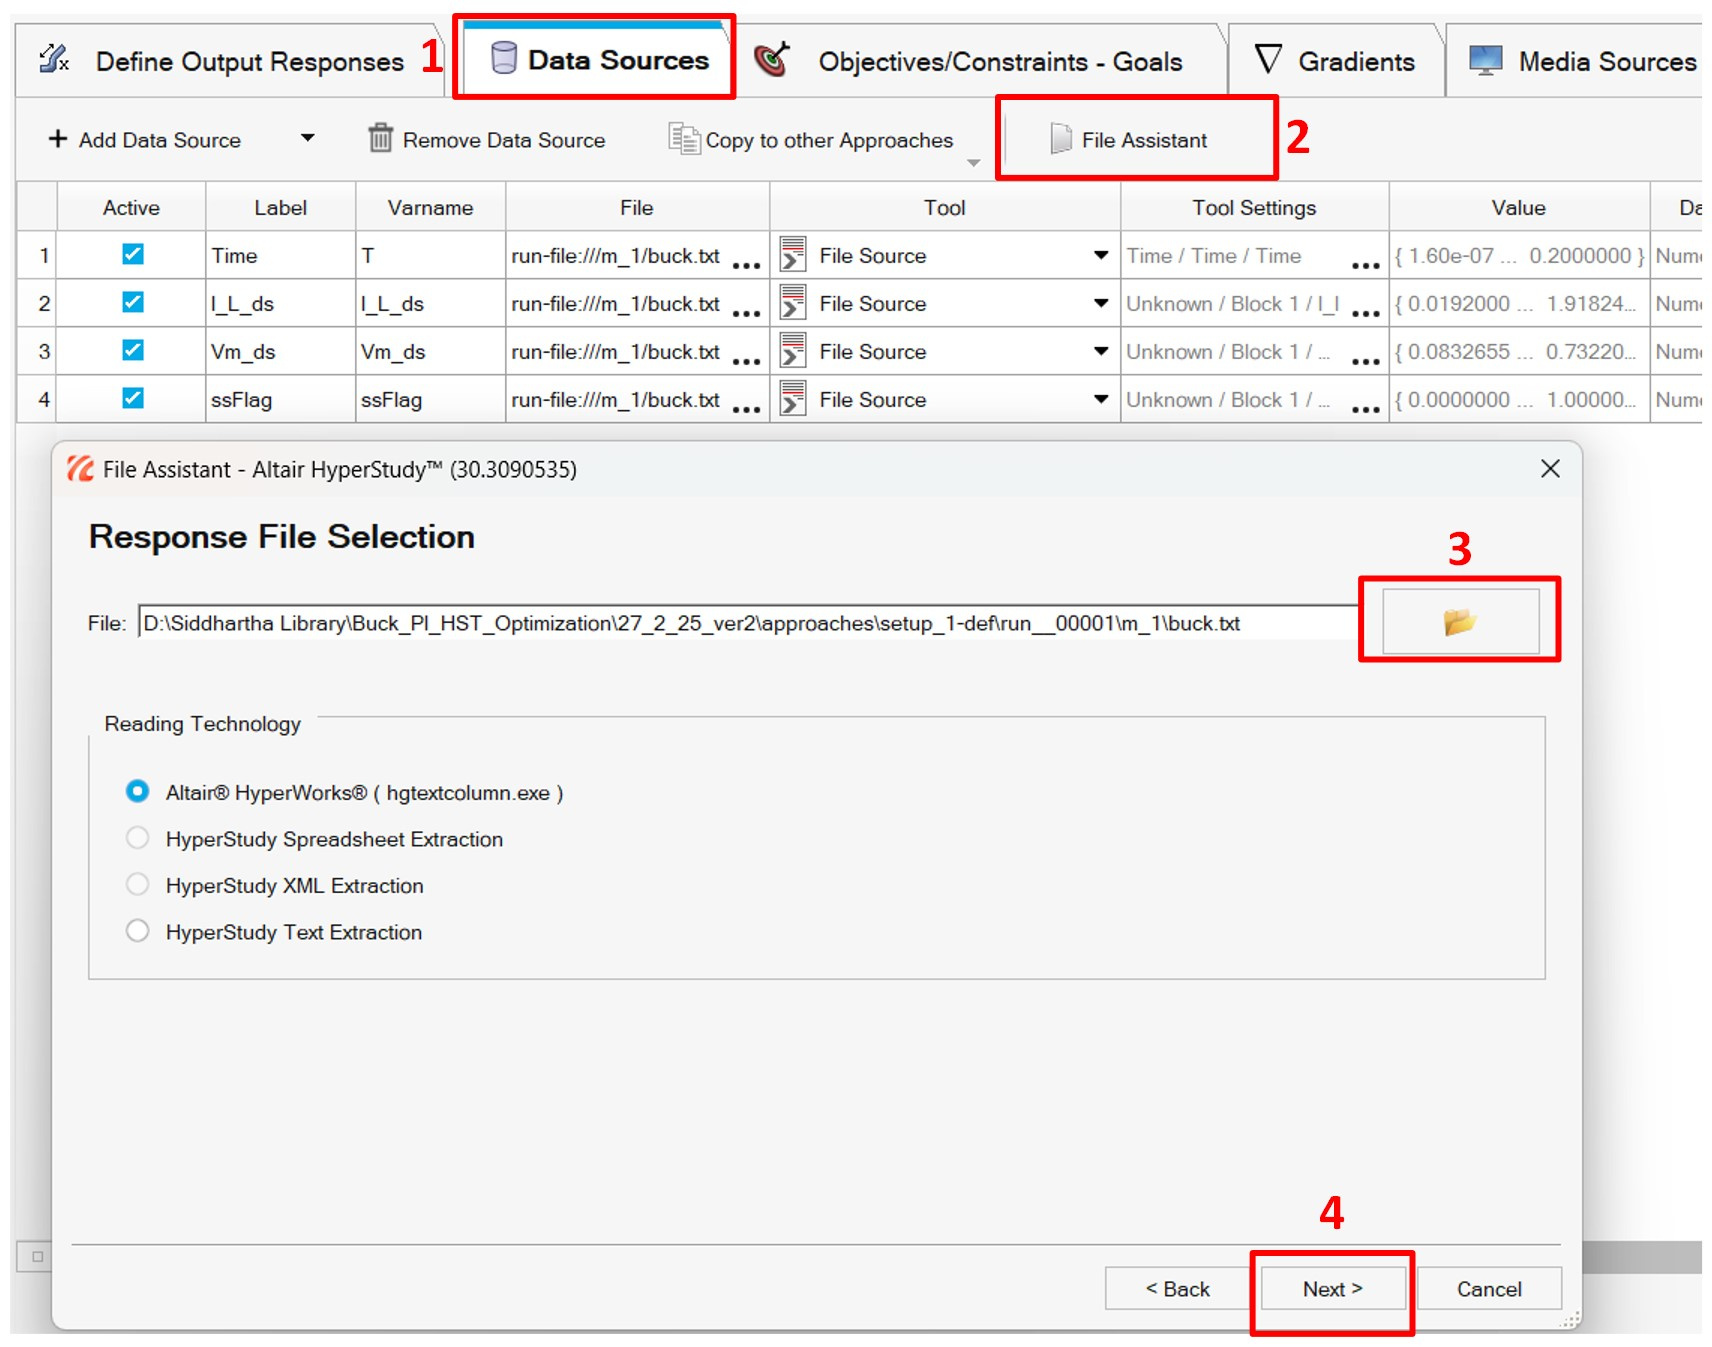
Fig4: Define Data Sources by using File Assistant
Add the following curves to the data sources:
- Time
- I_L_ds – Inductor Current
- Vm_ds-Modulating Signal (PI controller output)
- ssFlag – Steady State Flag
Step4: Use the data sources to define the Output Responses, the default operation (“max(var)”) is good enough for how these characteristics are measured in PSIM:
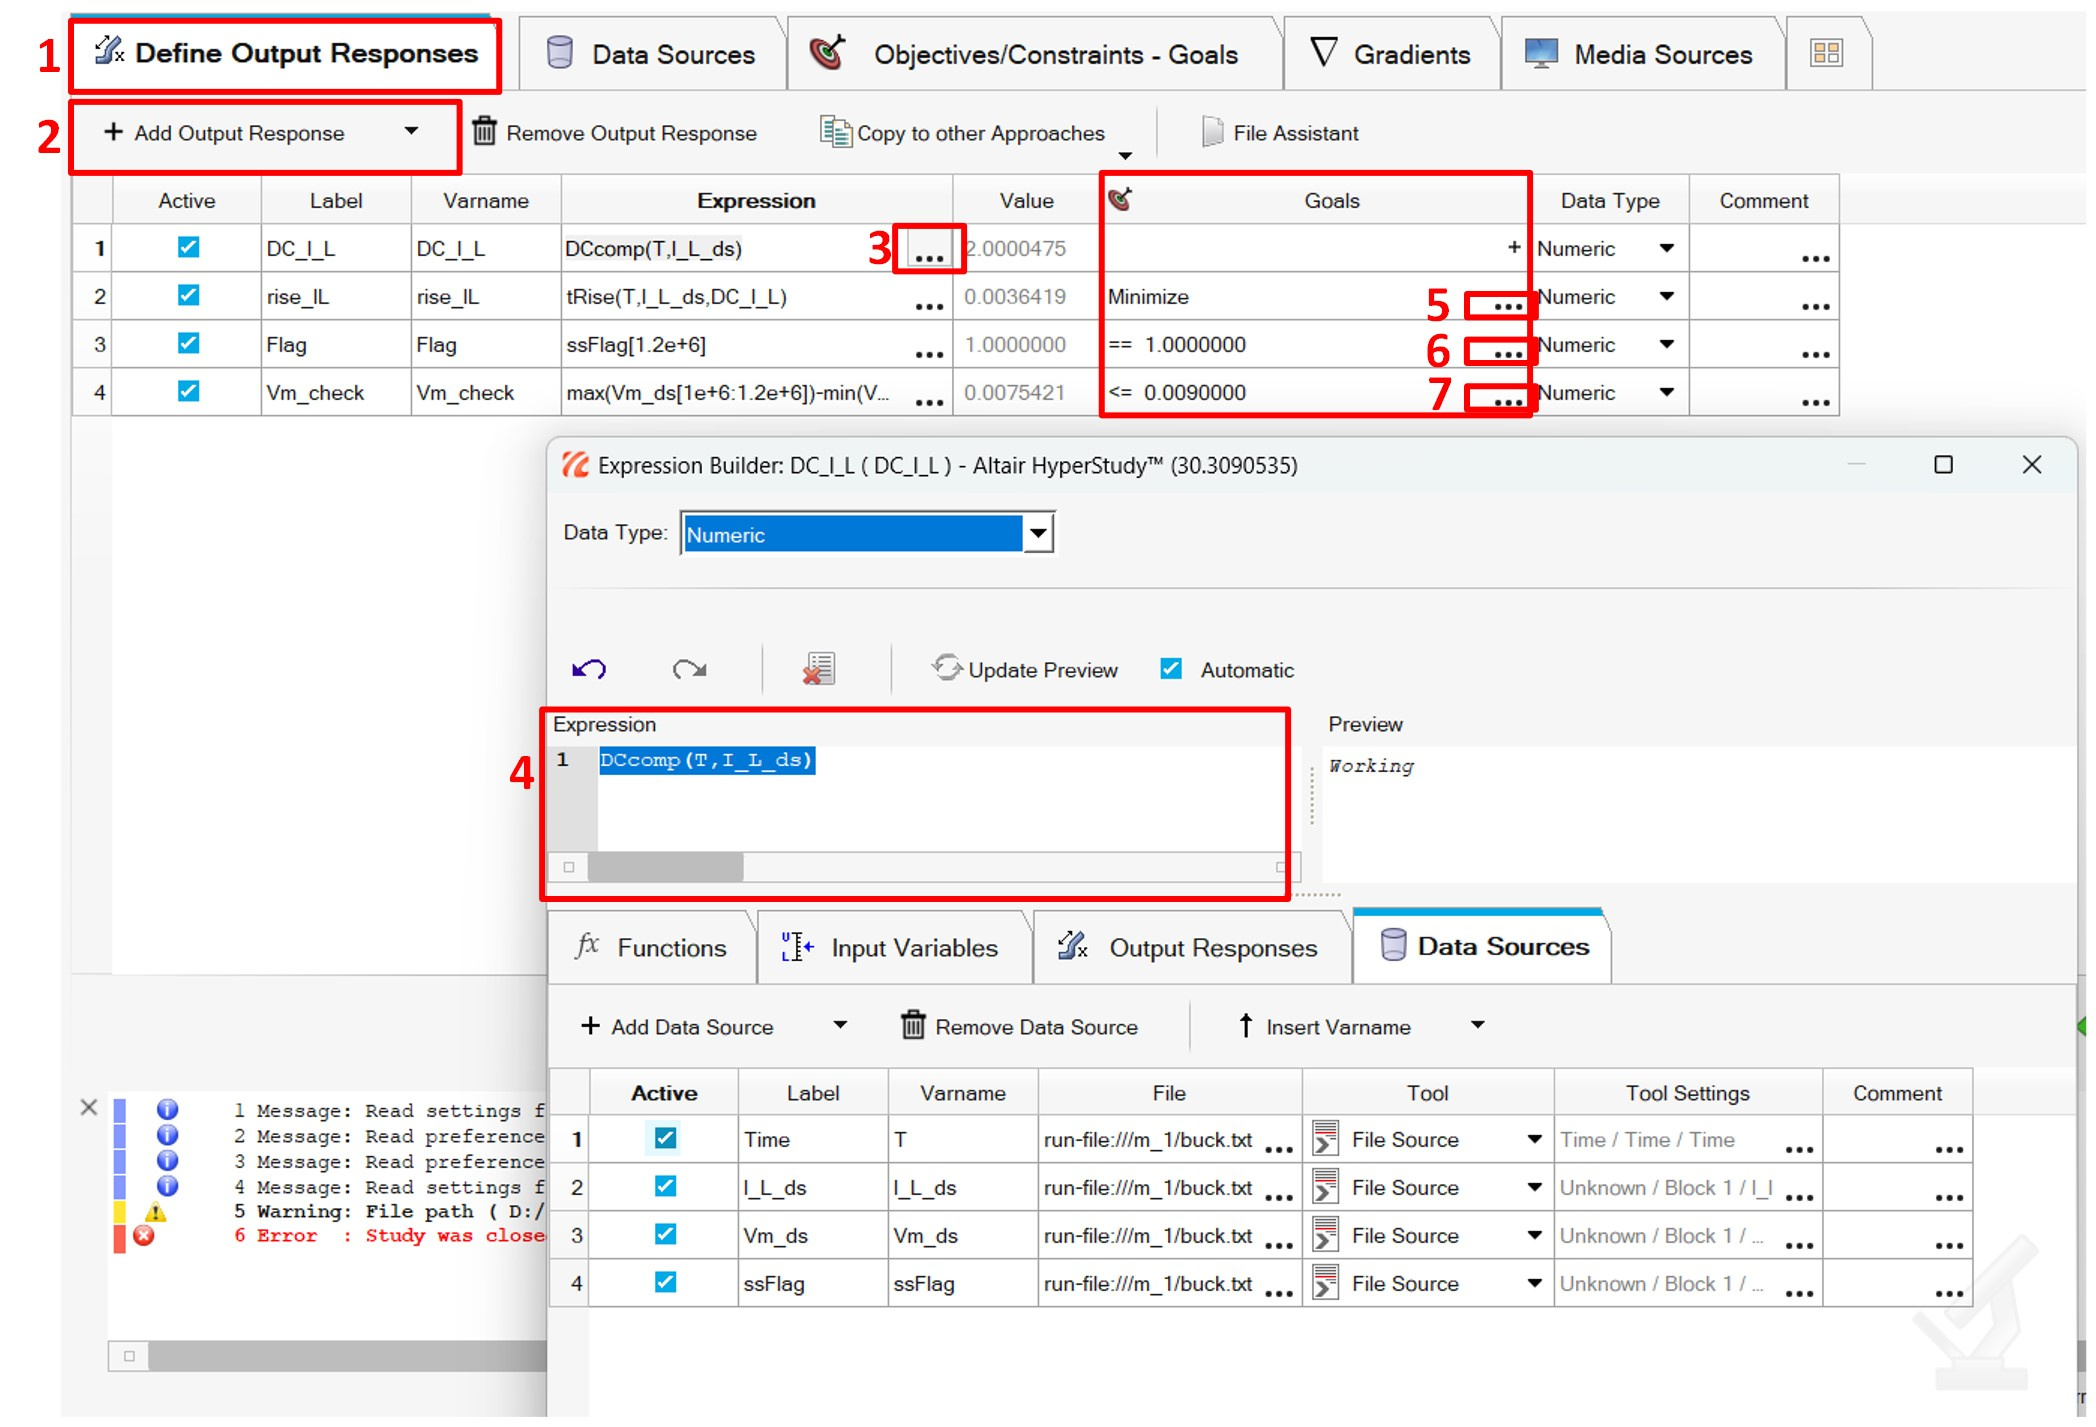
Fig5: Define Output Sources and Optimization Goals
HyperStudy provides built-in functions such as max(), min(), mean(), etc., for processing responses. However, for specific tasks like calculating the rise time of a signal—where no built-in function exists—you can register your own custom functions using either Compose or Python.
With the Output Responses defined and adding goals finish the setup process.
Step5: The last step is creating an optimization with the setup as a source (Right Click on Study Explorer > "Add")
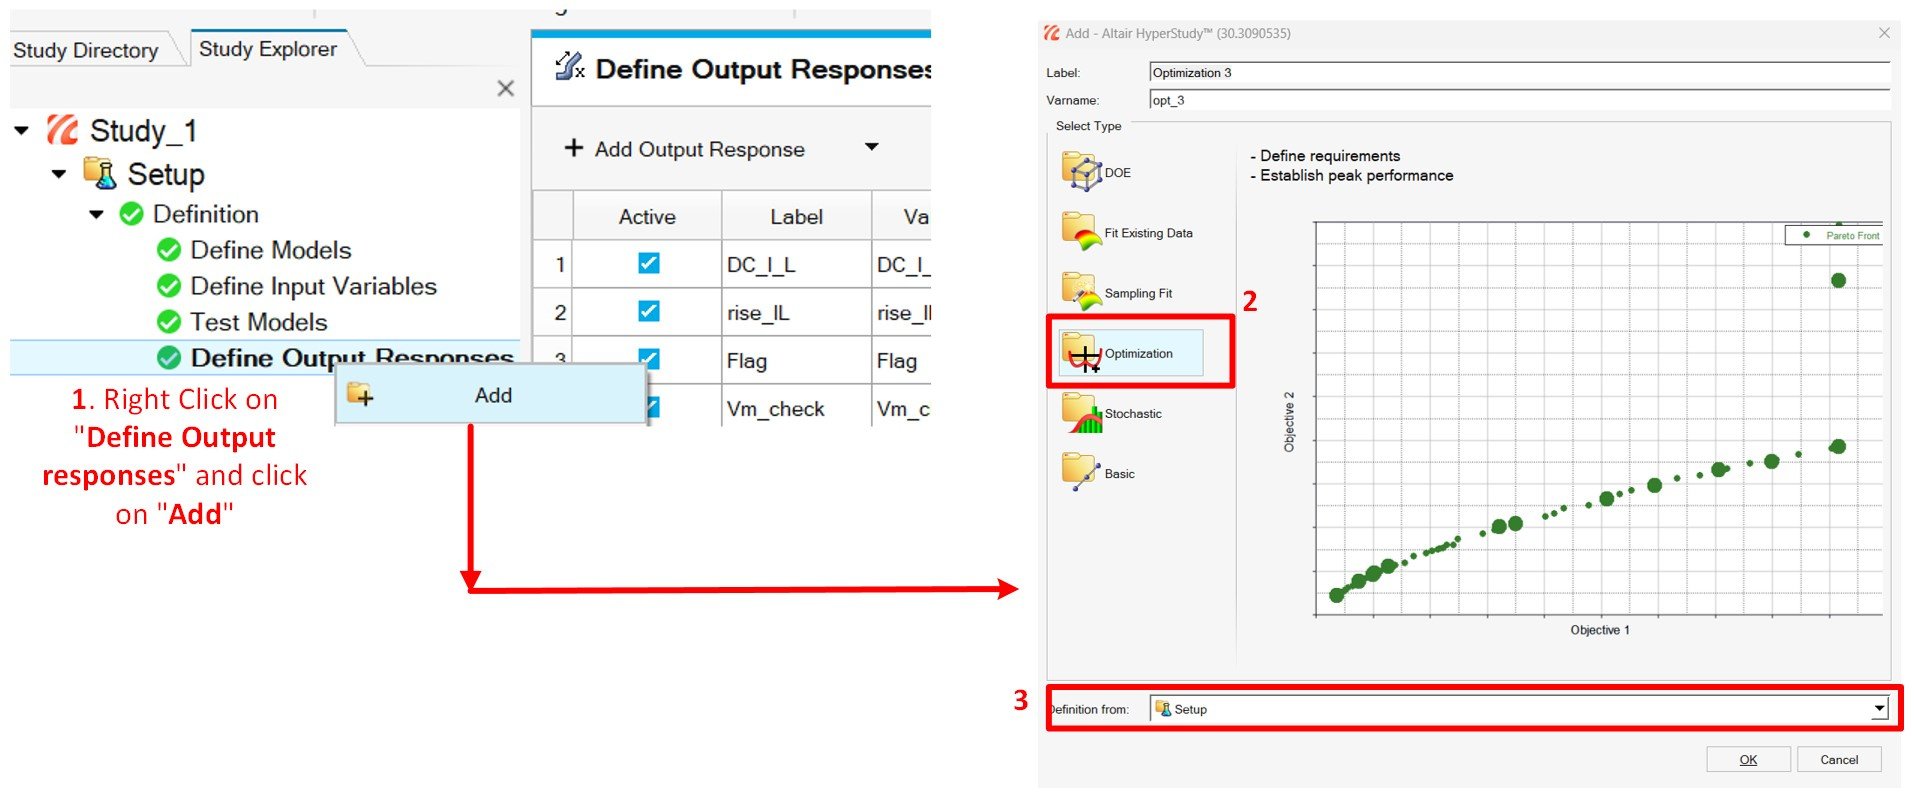
Fig6: Creating Optimization from setup
Step6: From the "Specifications" tab, we just need to select GRSM as the optimization method and enter the number of evaluations required (It’s a choice of user).
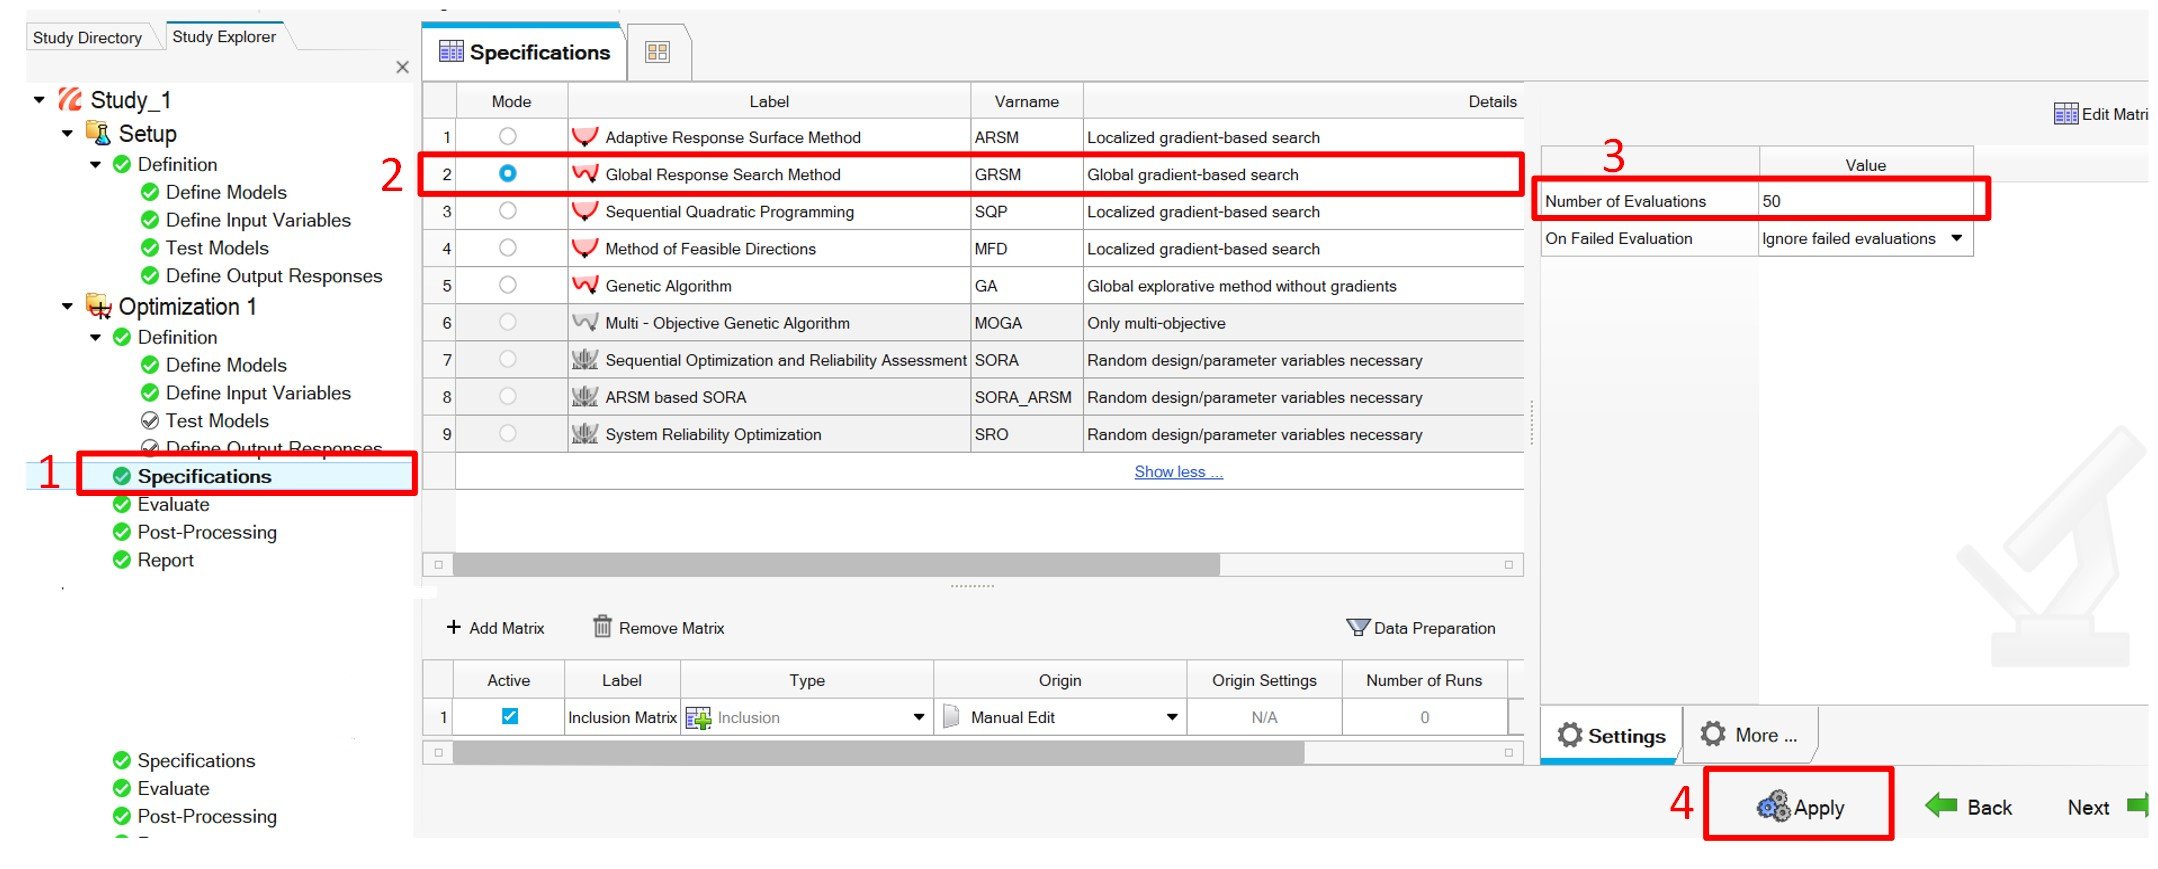
Fig7: Selecting Optimizing Method
Step7: Finally, from the "Evaluate" tab, start the process.
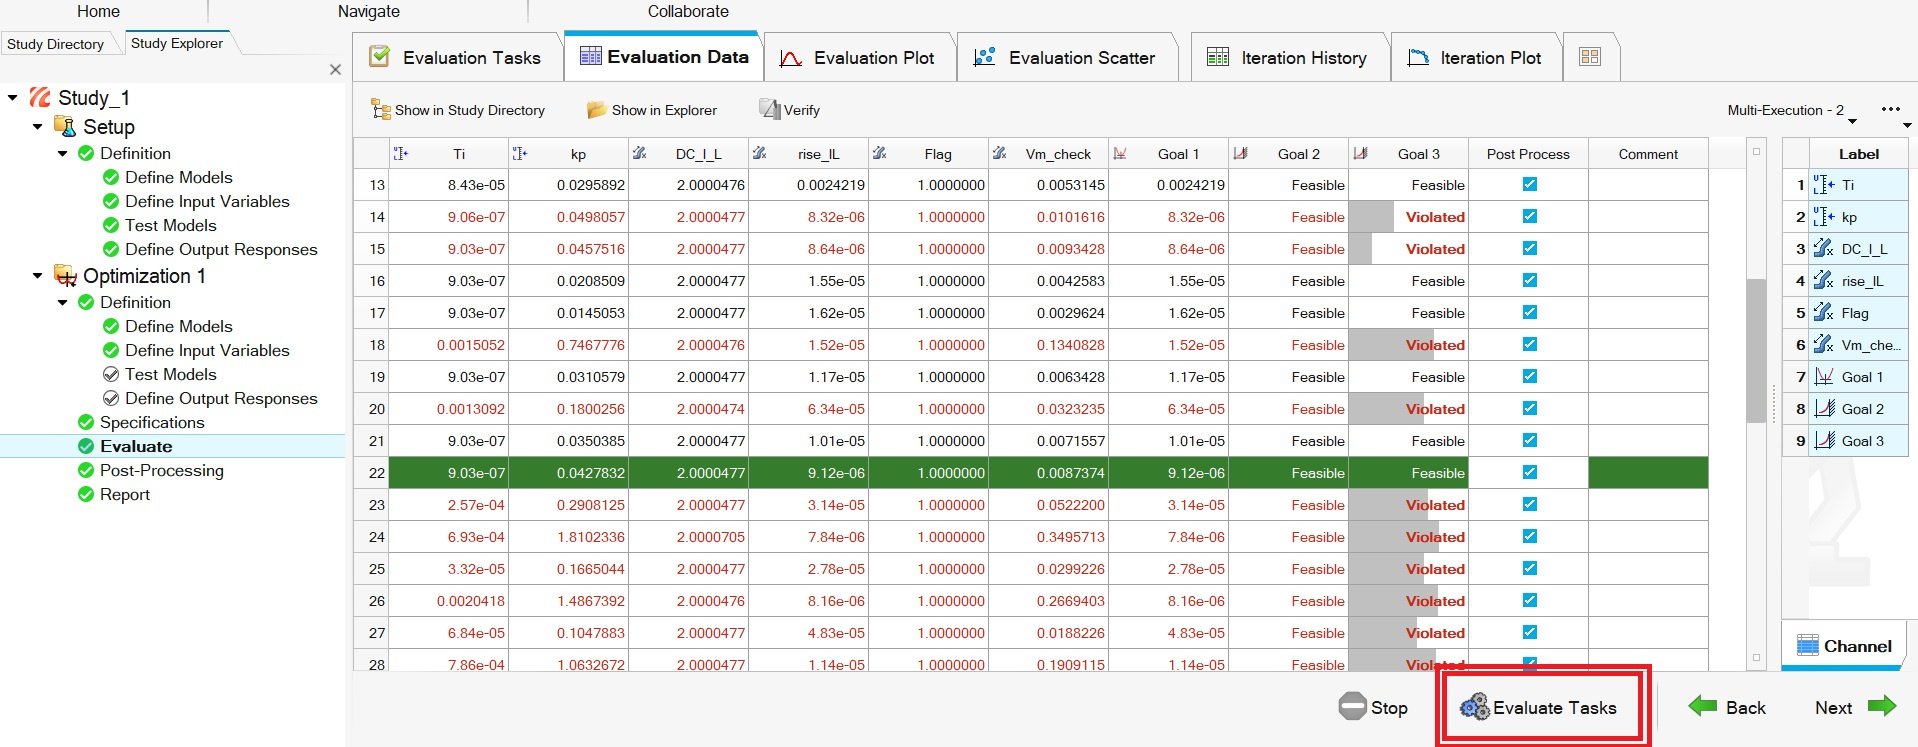
Fig8: Evaluation step
After all evaluations are completed, Rows in Green are the most optimal values.
Results:
In this study, PI controller parameters (Kp, Ti) for a Buck converter were optimized using HyperStudy, with the goal of improving transient response (rise time) and limiting inductor current. Here's the optimized results and it's closed loop response:
Case | Objective(s) | Kp | Ti | Rise Time (HyperStudy) | Rise Time (PSIM) | Peak Current (HyperStudy) | Peak Current (PSIM) |
|---|
1 | Minimize rise time | 42.7m | 0.9µs | 9.13 µs | 9.13 µs | — | — |
2 | Minimize rise time +
Peak current < 2.25 A | 50m | 44.7µs | 68.2 µs | 68.2 µs | 2.23 A | 2.23 A |
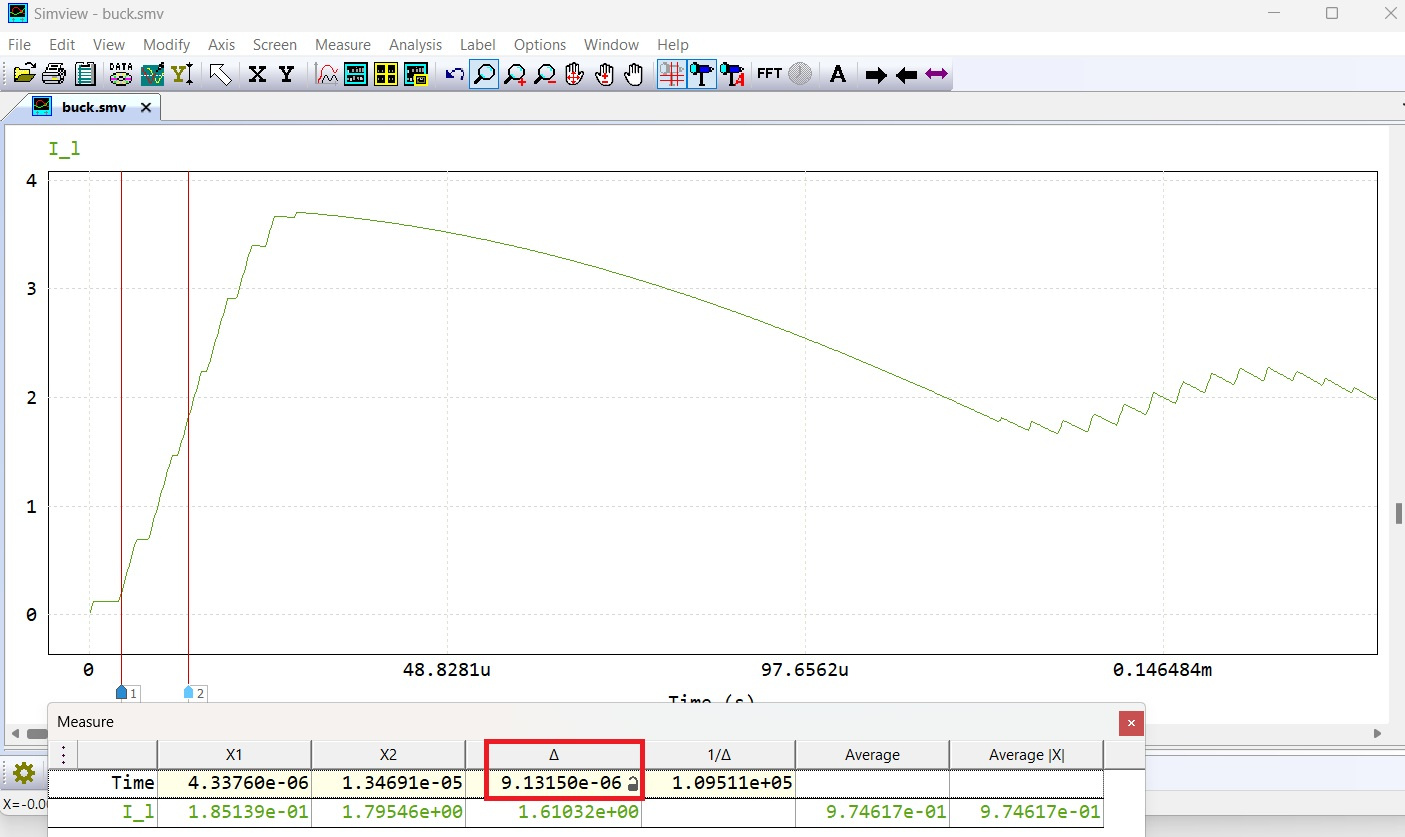
Fig9: Case1: Optimized response (Goal is to minimize the rise time)
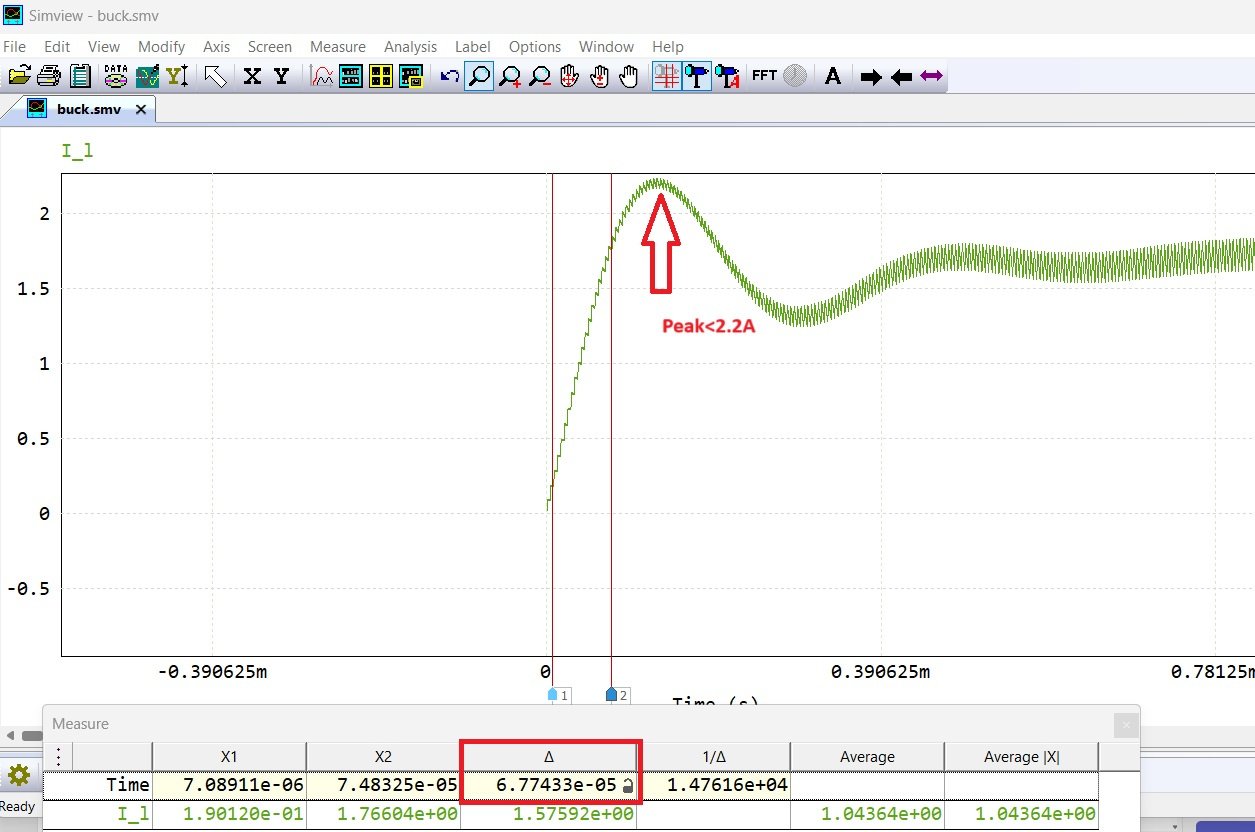
Fig10: Case2: Optimized response (Goals are to minimize rise time and limit the peak value)
Simulation Files:
Learn More:
