Introduction and Workflow Overview
HyperStudy is a data analytic AI tool that is used to generate the data and then train a fit model of a power converter. PSIM is the simulation tool that is used to simulate the full fidelity power converter that will generate the data for the fit model. TwinActivate is the system simulation tool used to run the final system simulation. The complete workflow to generate the fit model is shown in Fig 1.
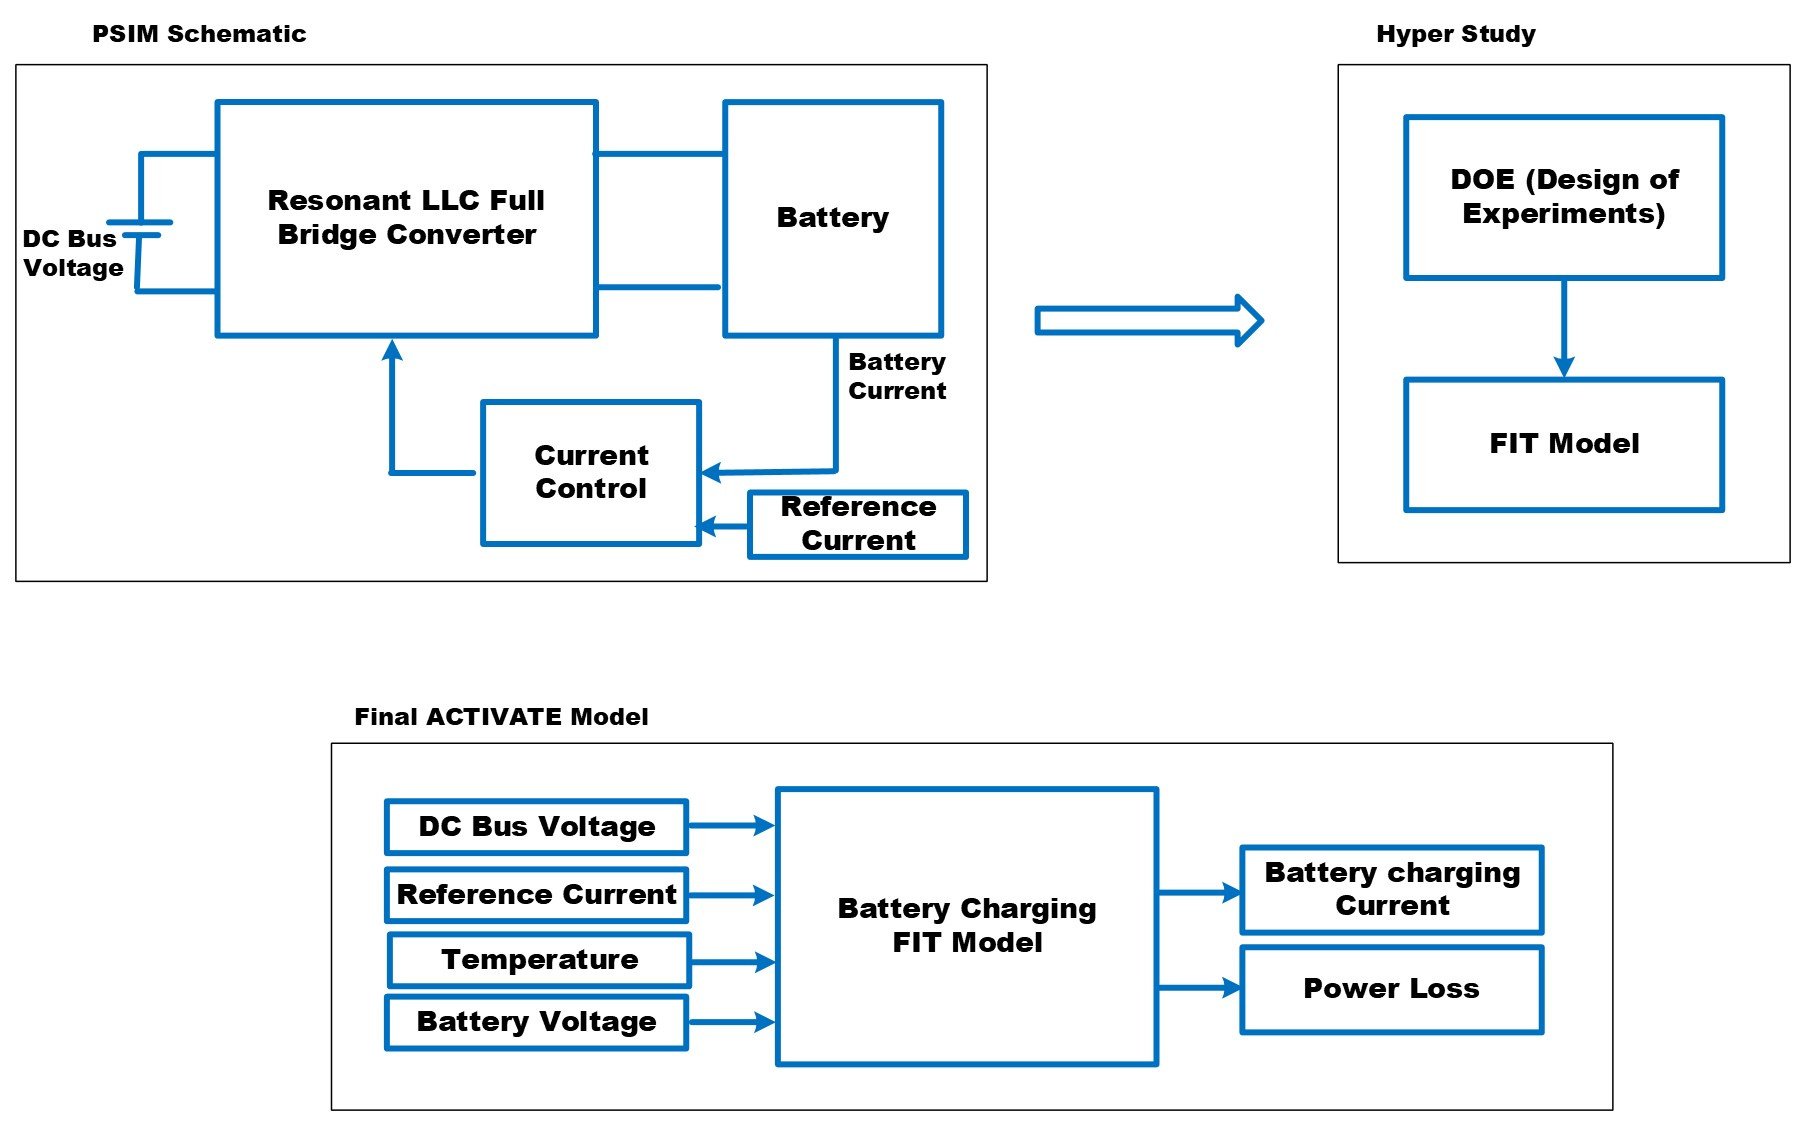
Fig.1: Workflow for FIT model generation
Practical Example: LLC Resonant Converter for Battery Charging
In this example, an LLC resonant converter is modeled for battery charging, a key application in both EV fast charging and telecom/energy systems (globally). The system uses a dual-loop control: an inner current loop embedded in the FIT model, and an outer loop managing CV or CC charging modes. This was implemented as shown in Fig. 2. This fit model takes four inputs: DC bus voltage, Temperature, Battery voltage, reference current. The outputs are simply losses and junction temperature from the converter switches, and the charging current for the battery.
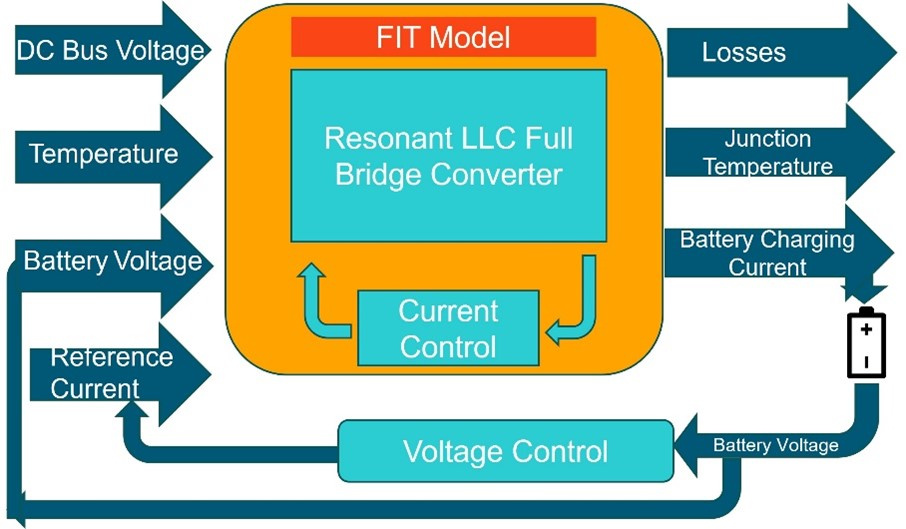
Fig.2: LLC Resonant Converter based Battery Charger FIT model description
The PSIM schematic for an LLC resonant converter in a battery charging application is shown in Fig. 3., the inner current loop was included as part of the fit model. It is a critical step to include the inner current loop as this creates a more stable and higher quality fit model. Fig. 4 shows the final system model in TwinActivate tool.
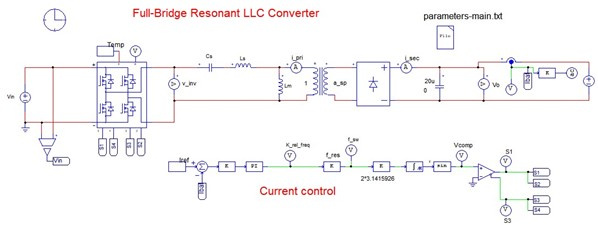
Fig.3: PSIM schematic of LLC Resonant Converter
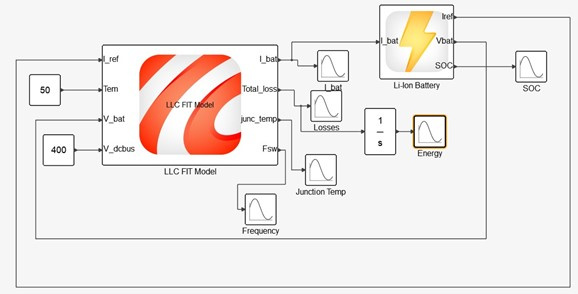
Fig.4: Final battery charger system with LLC Fit model
Performance Evaluation of the FIT Model
To evaluate the FIT model, we simulated the same battery pack being charged under three constant current levels: 10A, 30A, and 45A. Each case ran until the battery reached full SOC. This multi-scenario test setup helps verify the model’s ability to predict losses, junction temperatures, and dynamic frequency shifts under different load conditions.
Case 1: Constant Temperature, Varying Charging Currents
The simulation results with Fit models are shown in Fig. 5 at constant temperature and different charging currents.
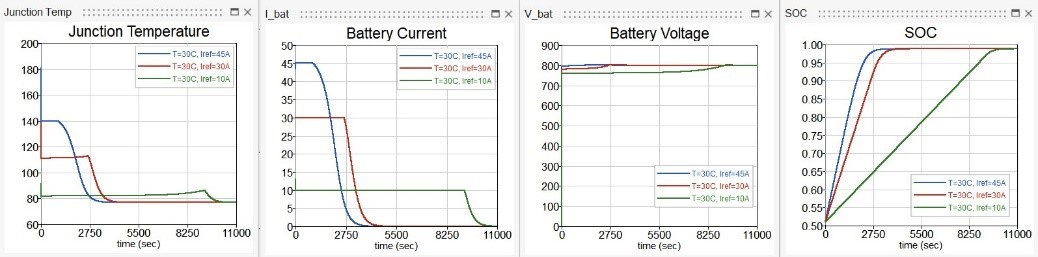
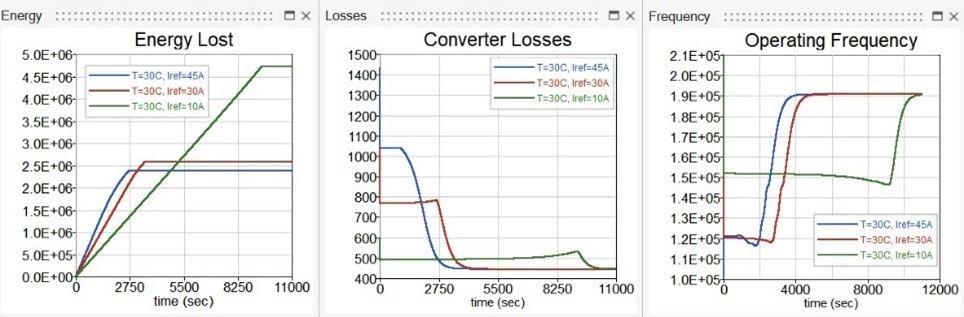
Fig.5: Simulation results of Fit model at constant temperature, different charging currents
Observations:
- Energy Loss Trends:
- Lower charging currents (e.g., 10A) exhibit nearly 2x higher total energy loss compared to 45A, due to extended charging duration.
- Switching Loss Behavior:
- At lower currents, switching frequency increases, resulting in higher switching losses due to soft-switching boundary shift.
- As charging progresses to CV mode, frequency gradually rises across all current levels.
In addition to charging current variations, simulations were run at 25°C, 45°C, and 65°C to capture the impact of ambient temperature on thermal performance. These temperatures represent real-world conditions—from overnight charging (25°C) to hot summer afternoons (45°C) and worst-case cabinet heating (65°C) in various places across the globe. This helps evaluate junction temperature limits, loss trends, and the need for thermal derating under harsh conditions.
Case 2: Fixed Charging Current, Varying Temperatures
The simulation results with Fit models are shown in Fig. 6 at different temperatures and same charging currents.
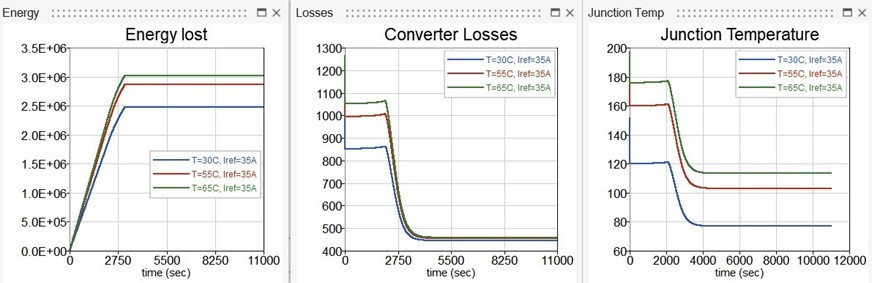
Fig.6: Simulation results of Fit model at different temperature, same charging currents
Case 3: Varying Current & Temperature
The simulation results with Fit models are shown in Fig. 7 at different temperatures and different charging currents.
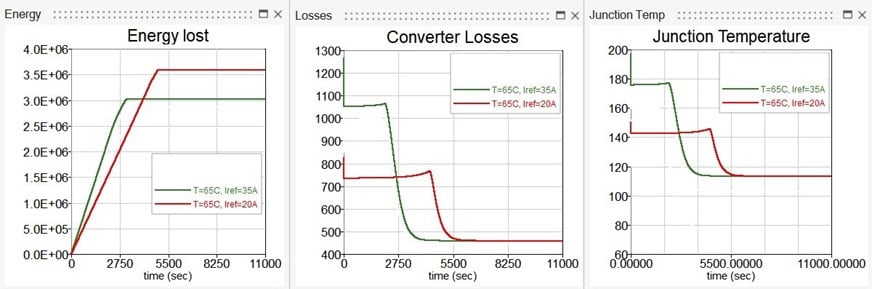
Fig.7: Simulation results of Fit model at different temperature, different charging currents
Observations:
- At 65°C, the junction temperature exceeds safe limits → Thermal protection required
- Practical Implication: In summer conditions (ambient > 45°C), forced derating or active thermal management is essential.
- Reducing charging current to 20A at high ambient (65°C) ensures junction temperature remains within limit → improves system reliability
A comparison of real time vs simulation time using fit or full fidelity is shown below.
Simulation time comparison
Charge Current | Length of Simulation | Fit model Simulation time taken | Full Fidelity Equivalent Simulation (projected) |
|---|
45A | 3000 sec | 14 sec | 6 days |
10A | 11000 sec | 51 sec | 23 days |
Although the real-world time span simulated is the same (e.g., 3000 s or 11000 s of charging), the simulation time taken differs drastically between full-fidelity PSIM simulations and the FIT model in TwinActivate due to computational complexity:
- PSIM full-fidelity simulations model every switching event at high resolution (e.g., 100 kHz switching frequency), requiring millions of time steps, especially over long durations.
- FIT models, by contrast, use a data-driven surrogate model that bypasses individual switching dynamics, focusing on system-level behavior. This allows the simulation to run at a coarser time scale (e.g., milliseconds or seconds), drastically reducing the computation time.
As a result, full charging cycles that take days to simulate with full fidelity can be executed in seconds using the FIT model, enabling rapid validation and design iteration.
Simulation Files:
Learn More:
- Accelerate your power converter design with PSIM & HyperStudy | Tutorial - Altair Community
- PSIM & HyperStudy for Fit Modelling
- Automating PSIM with HyperStudy vs Scripting
- Kia EV9: system level tradeoffs with PSIM & HyperStudy
- Insights into Motor Drive Design: Analyzing Trends and Long-Term Costs with PSIM and HyperStudy
- Fast Track eDrive Efficiency Maps & WLTP drive cycle with PSIM & HyperStudy
- Doing Multiple faults analysis on HyperStudy with PSIM models. - Altair Community
- Optimizing Design and Costs for a Second-Stage Power Supply Filter with PSIM & HyperStudy - Altair Community
- Get started with automated design exploration with PSIM + Hyperstudy | Altair Tutorial Video
