I am doing a linear buckling analysis of a pressure hull for a school project in optistruct and I have a question about the buckling mode(mag) results. To my understanding this contour should be the normalized eigenvector plot (maximum vector value should be 1 then normalized from there https://community.altair.com/community?id=community_question&sys_id=a846c8761b2bd0908017dc61ec4bcb6f) but what I don't understand is why certain modes in my analysis produce results with max values of less than one or greater than one. Why does this occur? Does it have any mathematical significance that I should be accounting for? Is it an indication of a model problem?
See example picture below.
<?xml version="1.0" encoding="UTF-8"?>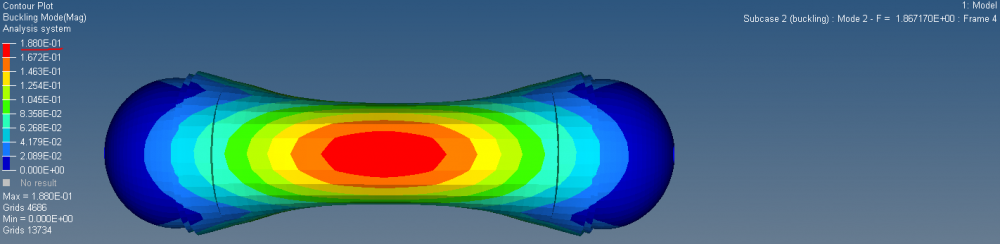
I even tried the OS-T 1040 3D buckling analysis tutorial model and extended it out a few extra modes and some of those modes do that same.
Any help or guidance would be appreciated
