TOTAL ENERGY PLOT
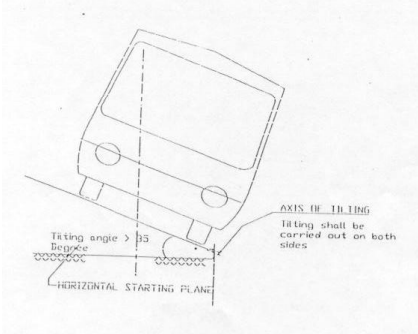
i'm trying to carry out a drop test with a body having initial velocity,
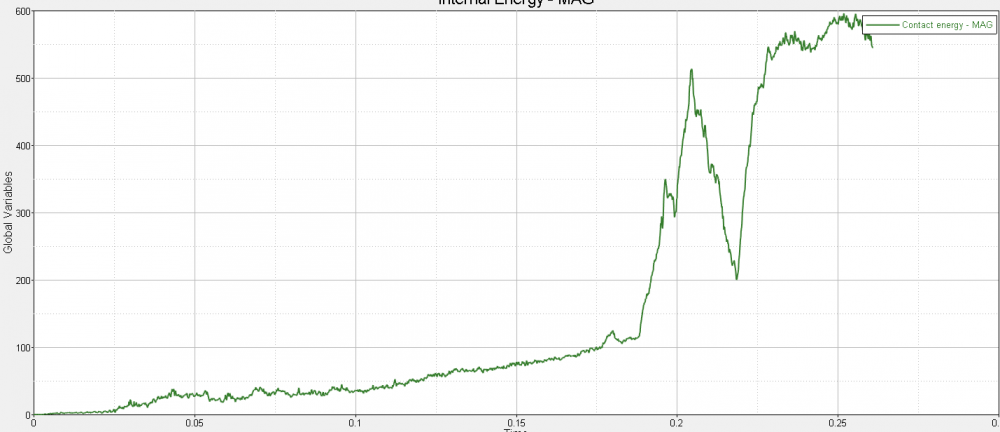
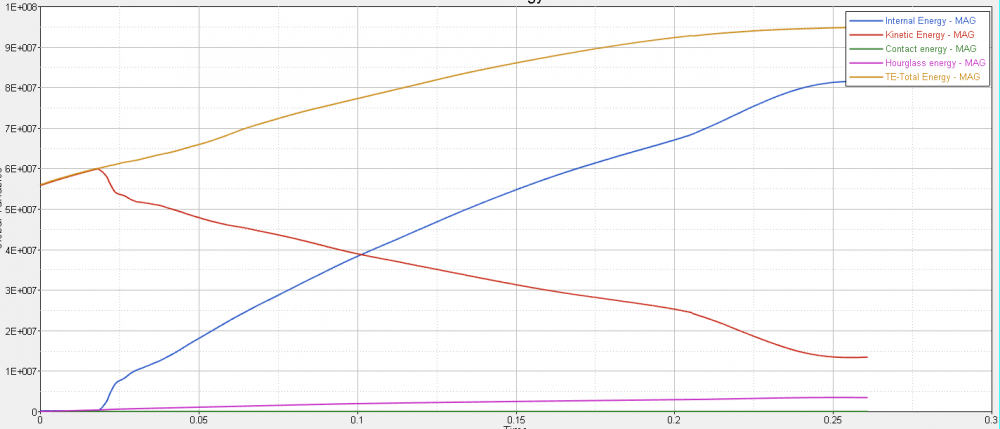
as soon as the the specimen impacts the ground the internal enrgy rises but kinetic energy of model is not reducing in that manner
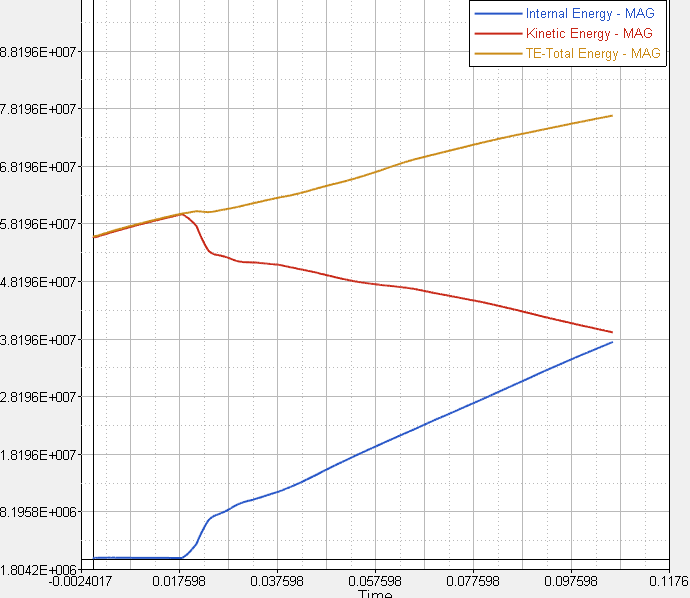
there is overall very high rise in total energy although the body is in proper contact with ground
total energy curve isn't remain constant or stable as soon as body touches ground.
Find more posts tagged with
Contact Energy is very less.
<?xml version="1.0" encoding="UTF-8"?>
Hourglass is under 10%limit of total
<?xml version="1.0" encoding="UTF-8"?>
here is complete plot of graphs<?xml version="1.0" encoding="UTF-8"?>
as you can see the internal energy absorbed by the structure is way more than total/ kinetic energy when impact happened, the impact happened at .02 sec from where kinetic energy starts declining.
the friction co-efficient is .2 its a planar rwall.
Somewhere from graph i infer that the kinetic energy of body is not decreasing as the slope of total energy almost remains constant before and after impact.
Hello Prakash,
Yes, i have taken the kerb weight for the calculation of angular velocity i have taken Moment of Inertia (xx) axis of rotation about abt c.g
and then used formula .5*(I+mr^2)= mh(hdiff)
r is distance of cg from rotation axis
hdiff is height diffrence (pre and post rotation to ground from point of unstability)
m is kerb weight of vehicle
there's no other mass in whole model even the tilting axis weighs less than a k.g (the mass of Fe model and bus are same 8.3 ton)
the angular velocity is around 2rad/s which is justified as i have carried out simulations on these values for the bus rollover analysis earlier.
contacts - all nodes are slave to rigid wall and have tried simulation with and without other contacts.
No 1 d elements in model
rigid and admass elements are present and they are assigned with boundary Condtion.
Dear Harshitpuri,
What about the gravity you have applied to the model?
Hello Ram,
Yes gravity is applied to the whole bus using curve except for stopper /snug
x 0
y -9810
x 1
y -9810
using grav load card
direction
Z is direction of height (+ve Upwards)
yes ram here it is
prakash i have uploaded the same in your dropbox
Hi Shriram,
From Analysis> select output block and choose comps from the selection menu and select all the parts, and thereby you can plot the time history for parts.
Please view this video tutorial at https://www.youtube.com/watch?v=Ef7Spn-j7fA&index=6&list=PL1u26y75SCrA_BOCLaSewVCNY7xRvCTnA where all these steps are shown.
Hi Harshit,
Check what is the contributing more to the total energy. Check whether the contact energy is within the limit or high also check the hour glass energy.
If the problem is with hour glass energy, change the element formulation to fully integrated.
If the problem is with contact energy, try changing the contact parameters.