This document explains how to access and interpret GDI logs for troubleshooting, covering both developer-level log inspection in Graph Studio and administrator-level access on the Graph Lakehouse server.
Contents
- Checklist
- Importance of GDI Logs
- Where GDI Logs are Generated
- Developer vs. Admin Capabilities
- For Administrators (Direct Server Access)
- Developer Steps (Query Builder)
- Troubleshooting Errors in Logs
- Discover Available UDX Extensions in Lakehouse
- Further Reading
______________________________________________________________________________________
Checklist
- For Developers (Query Builder): Developers can view logs from the Query Builder in the Graph Studio UI. We can run a specific SPARQL query to inspect log tables.
- For Administrators (Direct Server Access): Administrators can access detailed UDX logs, configuration files, and errors by using SSH to connect to the Lakehouse server.
- Check UDX Configuration: If logs are not appearing, an admin should verify that the
@udx property is set to true in the log.config file. - Resolve JDBC Driver Issues: If the logs show JDBC connection errors, we should check for the presence of the correct
.jar file in the /opt/anzograph/lib/udx directory on the server.
________________________________________________________________________________________
Importance of GDI Logs
GDI pulls data from external databases. To truly grasp what's happening and troubleshoot effectively, detailed logs are essential.
GDI creates these logs, showing its operations, including the precise SQL queries it sends to our database.
These logs are invaluable for:
- Understanding Underlying Issues: They clarify "what went wrong behind the scenes" if our data ingestion doesn't perform as expected.
- Query Verification: We can directly observe "what query GDI send to the server". This allows us to verify that the exact SQL queries GDI constructs and executes against our source database are correct and align with our intentions.
- Performance Insight: By examining the logged queries, we gain insight into how GDI optimizes data loading for massive datasets. This helps us "manage their query better".
______________________________________________________________________________________
Where GDI Logs are Generated
GDI logs are generated on the Lakehouse side, specifically within the Lakehouse environment that runs in Kubernetes (k8s).
Logs capture:
- SQL statements GDI sends to upstream sources (e.g., Databricks, PostgreSQL)
- File ingestion metadata from CSV uploads
- Partitioning and chunking logic applied during ingestion
- Errors and performance hints
GDI uses Java-based UDX (User Defined Extension) logging for this purpose.
________________________________________________________________________________________
Developer(User) v/s Admin Capabilities
Role | Logging Access | Methods |
|---|
Developer | View logs in Query Builder (Graph Studio UI) | Use SPARQL queries on log tables |
Admin (SSH) | Access detailed UDX logs, config files, errors | SSH to pod, access /log/, inspect config and jars, check full traces |
_______________________________________________________________________________________
For Administrators (Direct Server Access)
Administrators typically have direct access to the Lakehouse server where GDI logs are generated.
1.SSH into the Graph Studio Lakehouse Pod
kubectl get all -n <namespace>              # List all pods/services

kubectl exec -it pod/<anzograph-pod> -n <namespace> -- /bin/bash
2.Check UDX Configuration
cd /opt/anzograph/lib/jar/

cat log.config  # Ensure @udx is set to true
If @udx is not set to true , Graph Studio won't expose the logs to SPARQL queries.
3.Resolve JDBC Driver issues
If GDI logs show JDBC connection errors (e.g., for Databricks):
- Ensure JDBC jar is added to:
cd /opt/anzograph/lib/udx/
- Missing jars will cause errors like:
Could not read from "" ... connection error
_______________________________________________________________________________________
Developer Steps (Query Builder)
If UDX is properly configured, any user can run SPARQL to inspect logs:
SELECT *

WHERE {

  table 'sth_udx'

}

ORDER BY DESC(?time)
________________________________________________________________________________________
Troubleshooting Errors in Logs
Symptom | What to Check |
|---|
No logs appear in query builder | @udx not enabled in log.config |
JDBC connection error | Check .jar file presence in /lib/udx |
CSV ingestion fails | See gdi:message in logs — path, format issues |
____________________________________________________________________________________
Discover Available UDX Extensions in Lakehouse
Option 1: Programmatic UDX Check via Query Builder
This query retrieves a list of all loaded extensions, their versions, and descriptions, excluding the core system libraries.
- In Graph Studio, open the Query Builder (from the Access section).
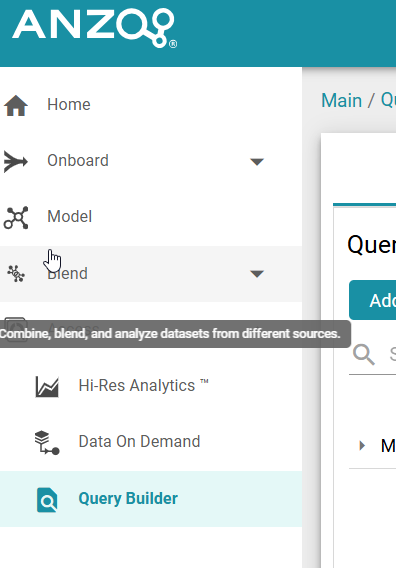
- Select the option to run a SPARQL query against specific Lakehouse.
- Paste the following query
SELECT ?library_version ?extension_name ?extension_kind ?extension_description

       ?extension_arguments ?extension_results

WHERE {

table 'stc_functions'

FILTER(?library_name!='system')

}
Option 2 : UI Based Check
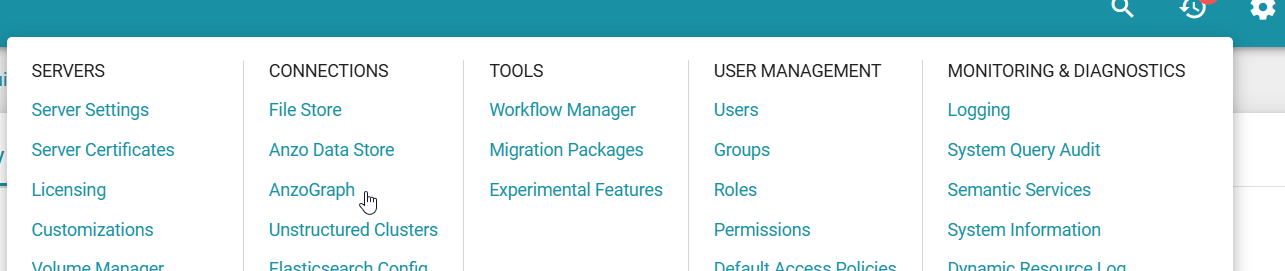
- Select the Admin Panel and Choose Anzograph
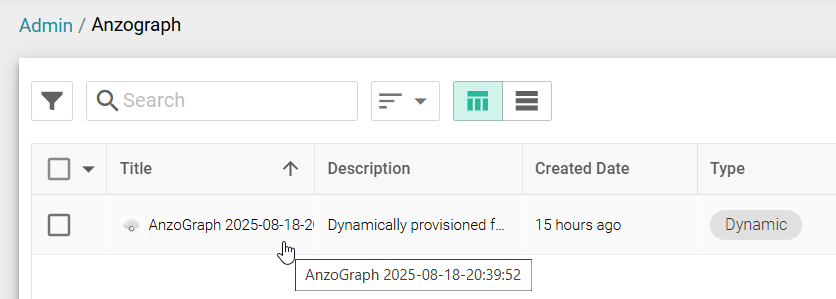
- Select the listed AnzoGraph
- Choose Extensions and that will list all the functions that are shipped.
- Shortlist GDI and explore the extensions and version.
- e.g., We used the
DataToolkitView extension in the examples.
_______________________________________________________________________________________
Further Reading
