How to Calibrate PM FlexTire™ Tire Model Inputs
Required Inputs:
- Tire CAD: Preferably STEP, or BDF.
- Physical measurements (or accurate high-fidelity FEA simulation results) at the target tire air pressure:
- Inflated radius
- Vertical force-deformation
- Rolling resistance
- (Optional) Contact patch area vs. vertical load
- (Optional) Lateral force-deformation
- (Optional) Torsional torque-deformation
The PM FlexTire™ solver requires, at a minimum, the elastic modulus, thickness, Poisson’s ratio, and global damping ratio for each tire component (rubber carcass, inner liner, belt liner, and sidewall). These inputs are stored in the .fxt file and calibrated to match target tire responses from physical testing or high-fidelity FEA simulation results.
Calibration is performed using Altair HyperStudy.
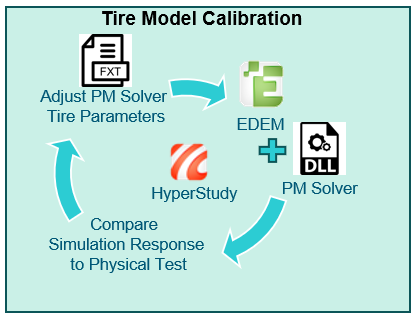
Calibration Approach
The calibration workflow adjusts:
- Elastic modulus
- Thickness
- Poisson’s ratio
- Global damping coefficient
This basic calibration workflow focuses on force-deformation and rolling resistance data for calibrating the isotropic material formulation in the PM FlexTire™ solver using HyperStudy.
Workflow Overview
The workflow consists of two main steps:
Force-Deformation Calibration
Rolling Resistance Calibration
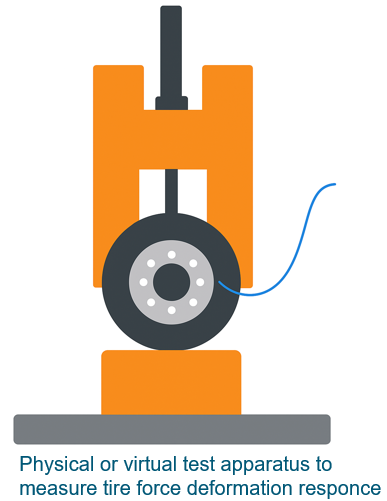
The first step involves running two sequential EDEM simulations. The initial simulation quantifies the radial expansion of the tire under pneumatic inflation pressure, as shown below.
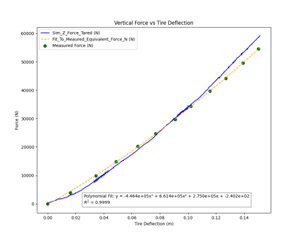
The second simulation, updated from the first to reduce solve time, quantifies the tire’s force-deformation response as shown below.
Using the HyperStudy Template
You can download the HyperStudy calibration file here:
The attached HyperStudy file has been revised from the original. The EDEM decks have been updated to use poly particles instead of spheres to more accurately represent the smooth surface on which the tire is physically tested. The Python post-processing script for tire inflation has also been modified to handle cases where the user-specified inflation rate is not achieved; in those situations, the inflation time is now set to zero. Finally, spaces in the original study’s file paths have been removed to avoid errors.
It is recommended to leverage this pre-configured HyperStudy model for your calibration workflow. To calibrate your specific tire:
- Update the CAD geometry in the EDEM simulations.
- Replace the target force-deformation and rolling resistance data with your own test data.
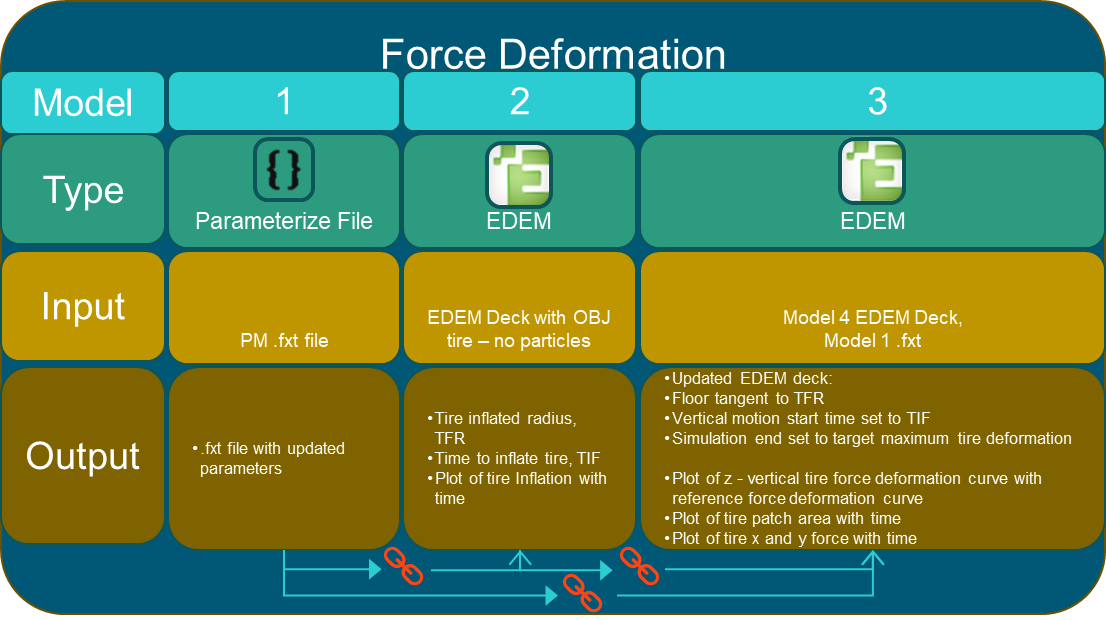
Force Deformation Calibration
Three models are used within the HyperStudy setup to calibrate PM FlexTire™ inputs based on force-deformation data. The first model is a parameterized .fxt file containing the material and geometric properties to be calibrated. The second model is an EDEM simulation to inflate the tire, capturing its radial expansion under pressure. The third model is an EDEM simulation to generate the virtual force-deformation curve, which is then compared to your target data for calibration.
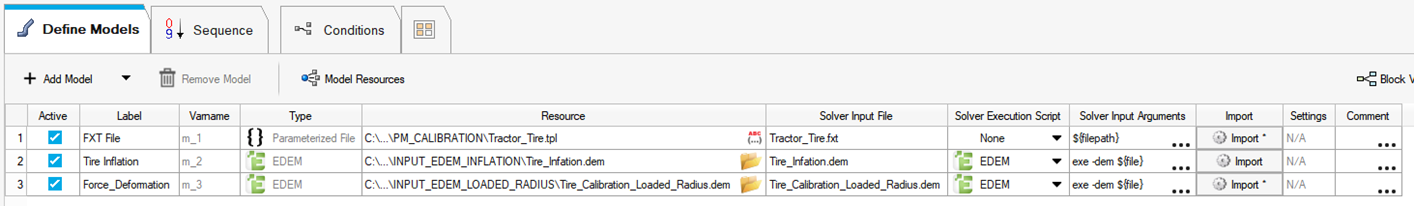
The HyperStudy user interface, used to manage and execute the PM FlexTire™ calibration workflow, is shown below:
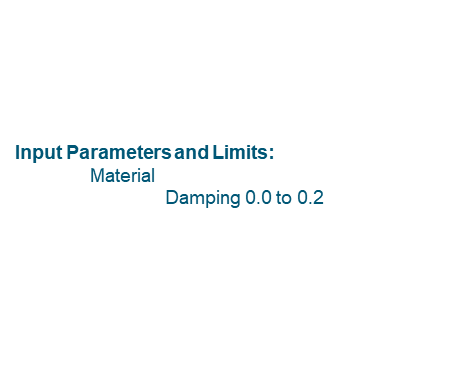
The input variables and their defined upper and lower bounds used in the calibration are shown below:
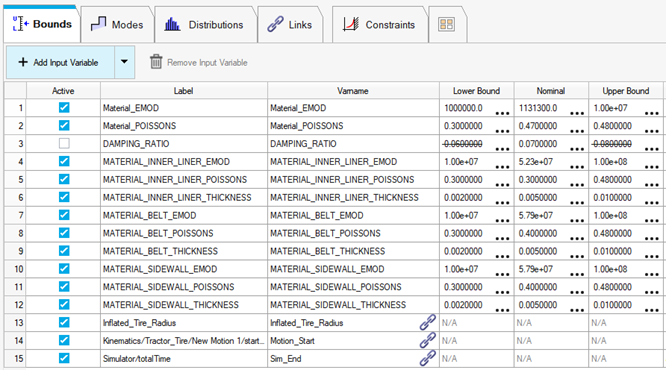
The table below lists the recommended input parameter ranges for calibrating an isotropic tire model.
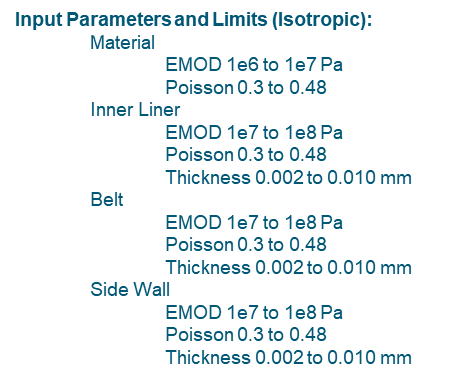
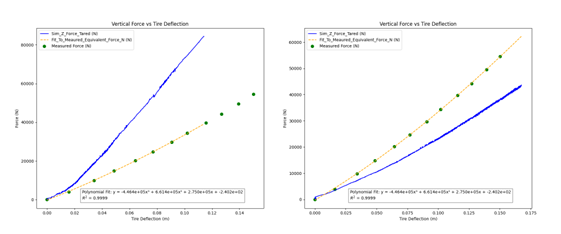
The first design of experiments (DOE) in this investigation used a D-Optimal approach with approximately 25 iterations. This DOE had two objectives: first, to verify that the simulated tire force-deformation curve (blue) fully envelops the target curve (orange), and second, to identify which input parameters have the greatest influence on the tire’s force-deformation behavior.
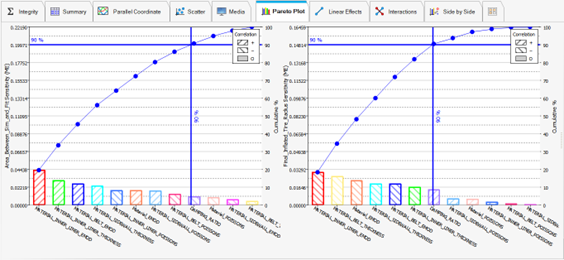
Use the Pareto plot to identify and eliminate factors with minimal impact on the tire’s inflated radius and the area between the curves before running the optimization.
In the final step, the model is optimized to minimize the difference between the target force-deformation curve and the simulation-generated curve.
Rolling Resistance Calibration
After calibrating the force-deformation behavior, the next step is to adjust the global damping coefficient to align the simulated rolling resistance with your measured target data.
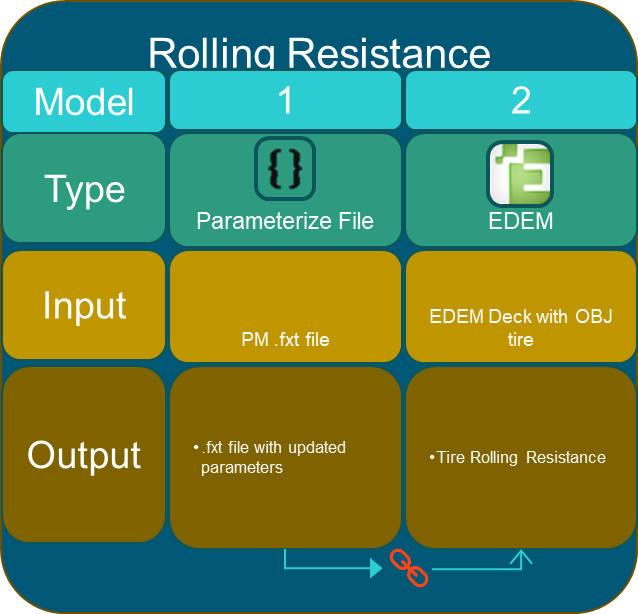
Two models are used within the HyperStudy setup to calibrate PM FlexTire™ inputs based on rolling resistance. The first model is the same parameterized .fxt file used during the force-deformation calibration. The second model is a final EDEM simulation used to quantify the tire’s virtual rolling resistance, which is then compared to the target data for calibration.
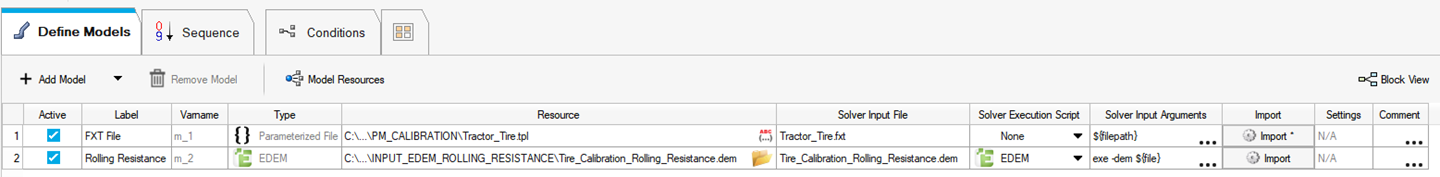
The HyperStudy user interface used to manage and execute the PM FlexTire™ rolling resistance calibration workflow is shown below:
The input variables and their defined upper and lower bounds for the rolling resistance calibration are shown below:
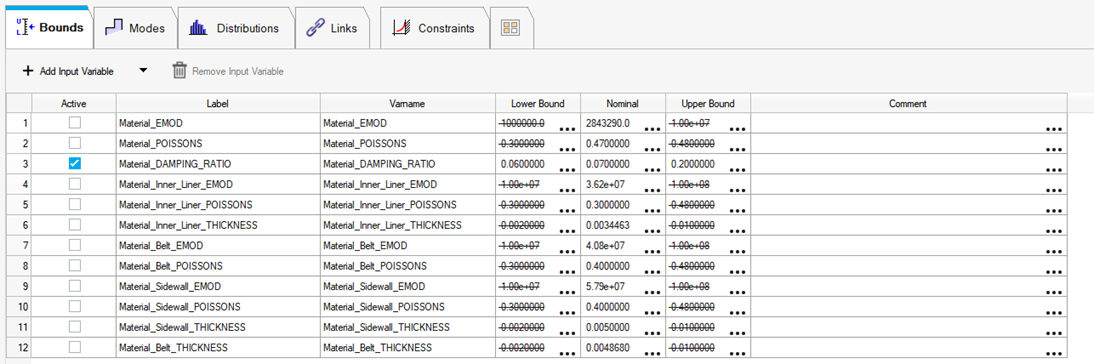
The table below provides the recommended input parameter ranges for calibrating an isotropic tire model.
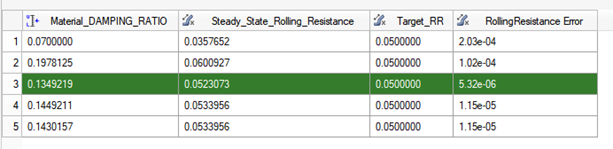
The first design of experiments (DOE) in this investigation used a D-Optimal approach with approximately two iterations. This DOE aimed to verify that the simulated tire rolling resistance fully captures and envelops the target rolling resistance value.
The output from the EDEM simulation, shown below, includes the forces acting on the tire in the three principal directions and the rolling resistance as a function of time. Rolling resistance is calculated as the ratio of Sim_X_Force to Sim_Z_Force.
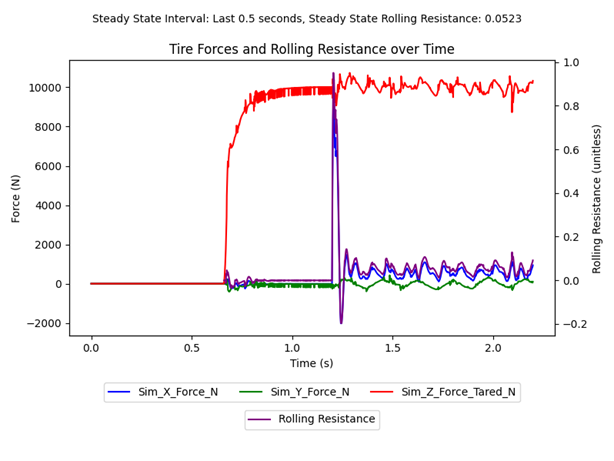
In the final step, the model is optimized to match the simulated rolling resistance with the target measurement.
How to Video
The Step-by-step video can be access here: Altair How-to-Video
Related Articles in This Series
