This page discusses the Peak Current Mode Control of a Buck Converter and explores how its operation can be automated with Altair HyperStudy. If you have not experimented with HyperStudy before, you should read this article as a first step.

What is PCMC and what are its advantages compared to other control techniques?
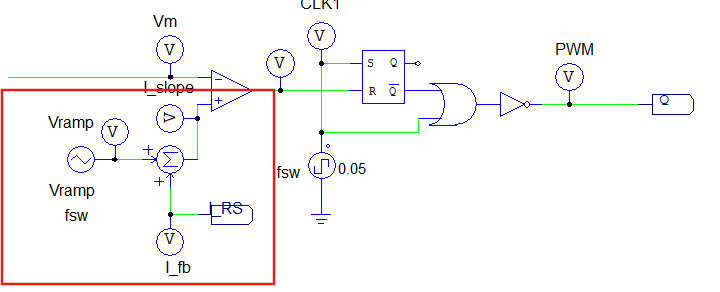
Peak Current Mode Control (PCMC) is a method used in switching regulators to monitor and control the peak inductor current during each switching cycle. This technique is preferred for its quick response, ease of implementation, and enhanced noise immunity compared to other control methods.
PCMC works by comparing the peak current to a reference signal to generate the PWM signal for the switching component. However, using this technique can lead to an unstable output voltage and the appearance of subharmonics.
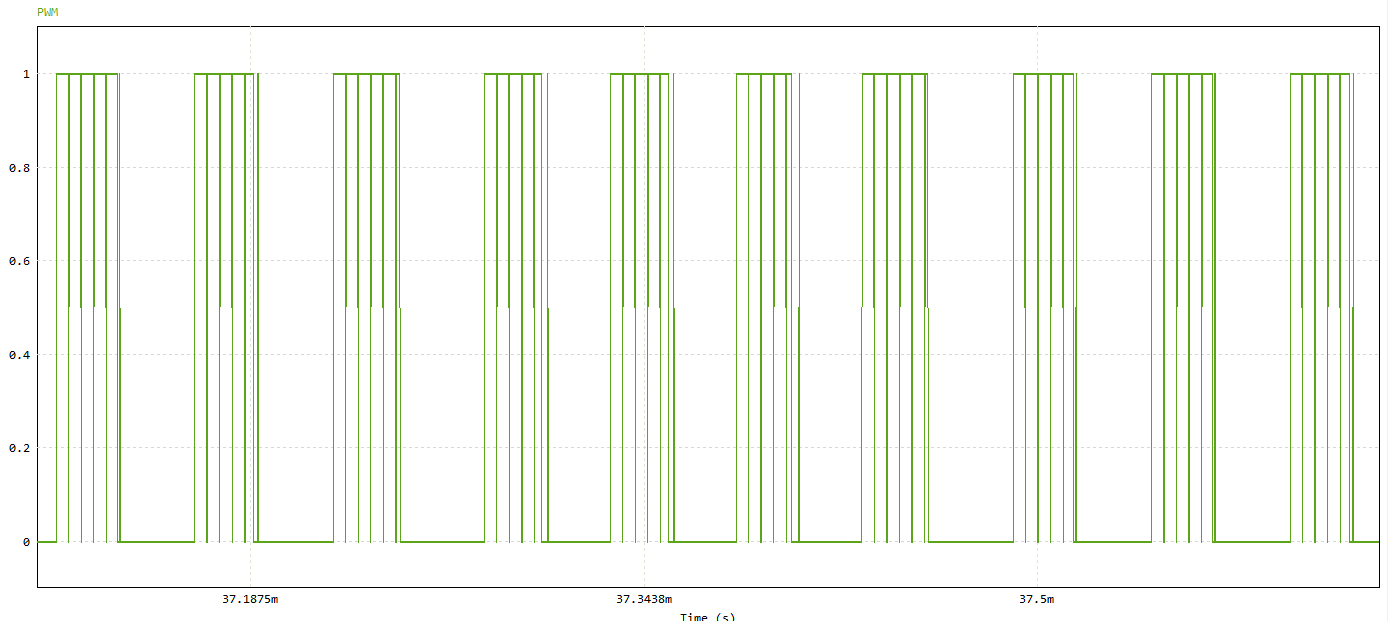
The switching frequency is set at 200 kHz, but we are noticing subharmonics around 20 kHz.
To address this, a compensation slope is added to the current feedback to eliminate subharmonics and stabilize the output signal.
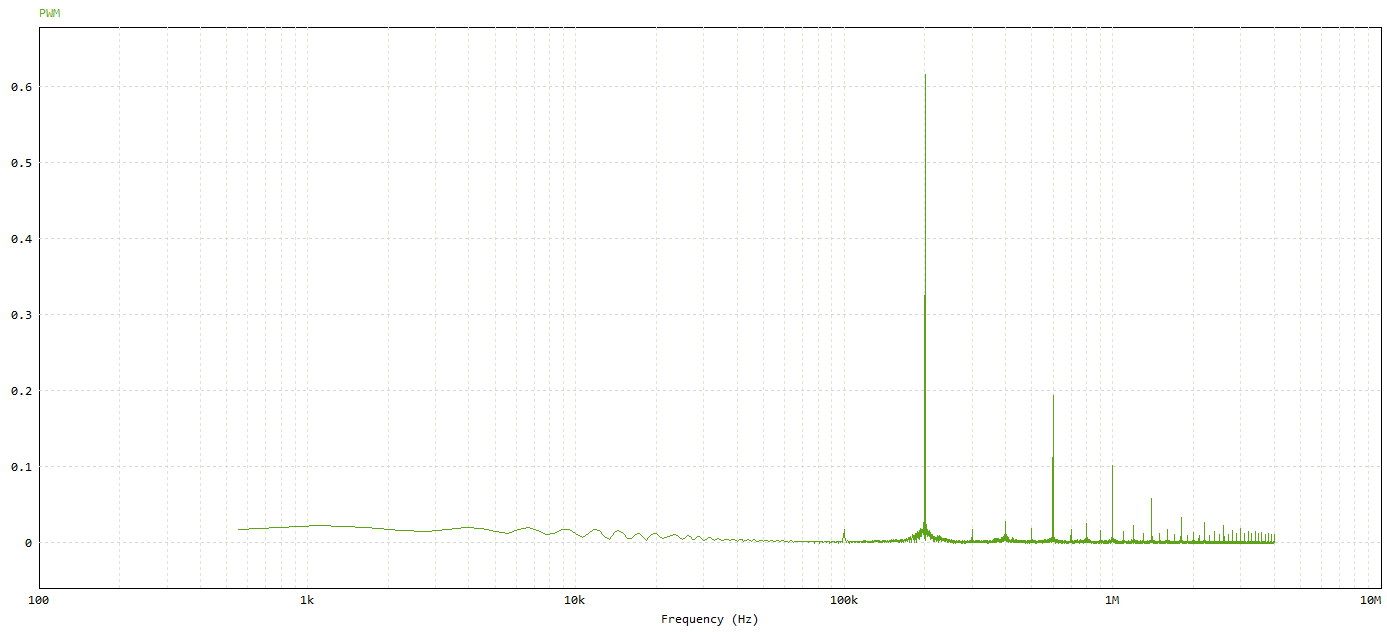
If the compensation slope is insufficient, some subharmonics may still persist. Therefore, finding the optimal value for this slope is crucial to eliminate undesirable subharmonics and produce a smooth PWM signal like the following one.
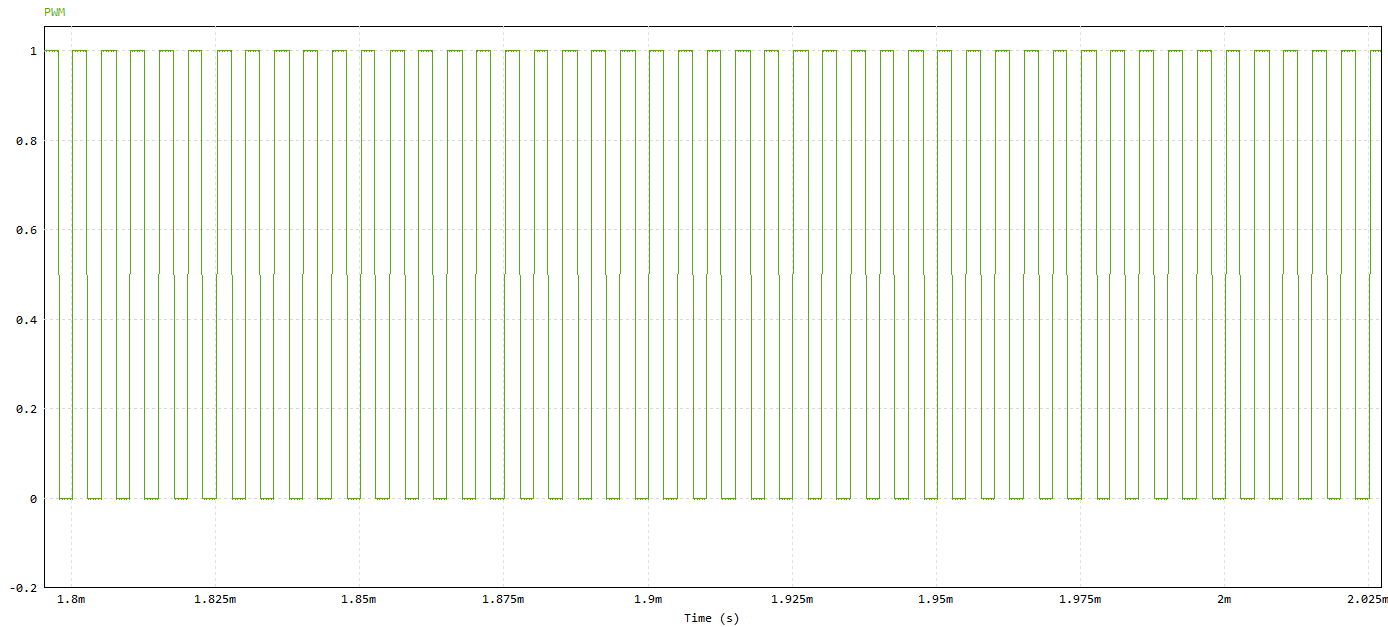
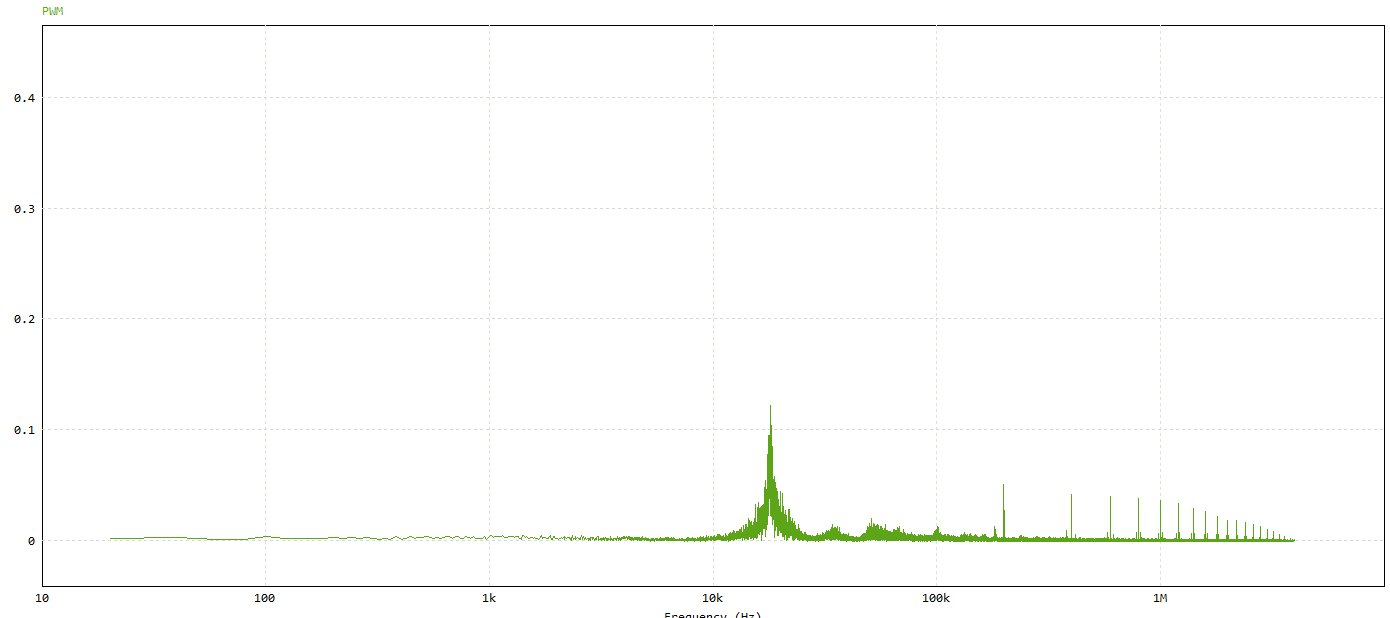
The PWM signal is smooth, and we observe that the strongest harmonic appears at the switching frequency (200kHz)
Once this process is complete, the PI controller can be adjusted to fine-tune attributes of the output voltage, such as ripple, overshoot, rise time, and settle time. HyperStudy assists in optimizing these signal attributes in relation to the slope compensation and controller gains.
PSIM model design
First, we will design a buck converter circuit in PSIM using Peak Current Mode Control (PCMC). As previously mentioned, subharmonic oscillations may occur. To ensure smooth converter operation, we will analyze its behavior under different load conditions. During the simulation, we will introduce a variable load by adding series and parallel resistors.
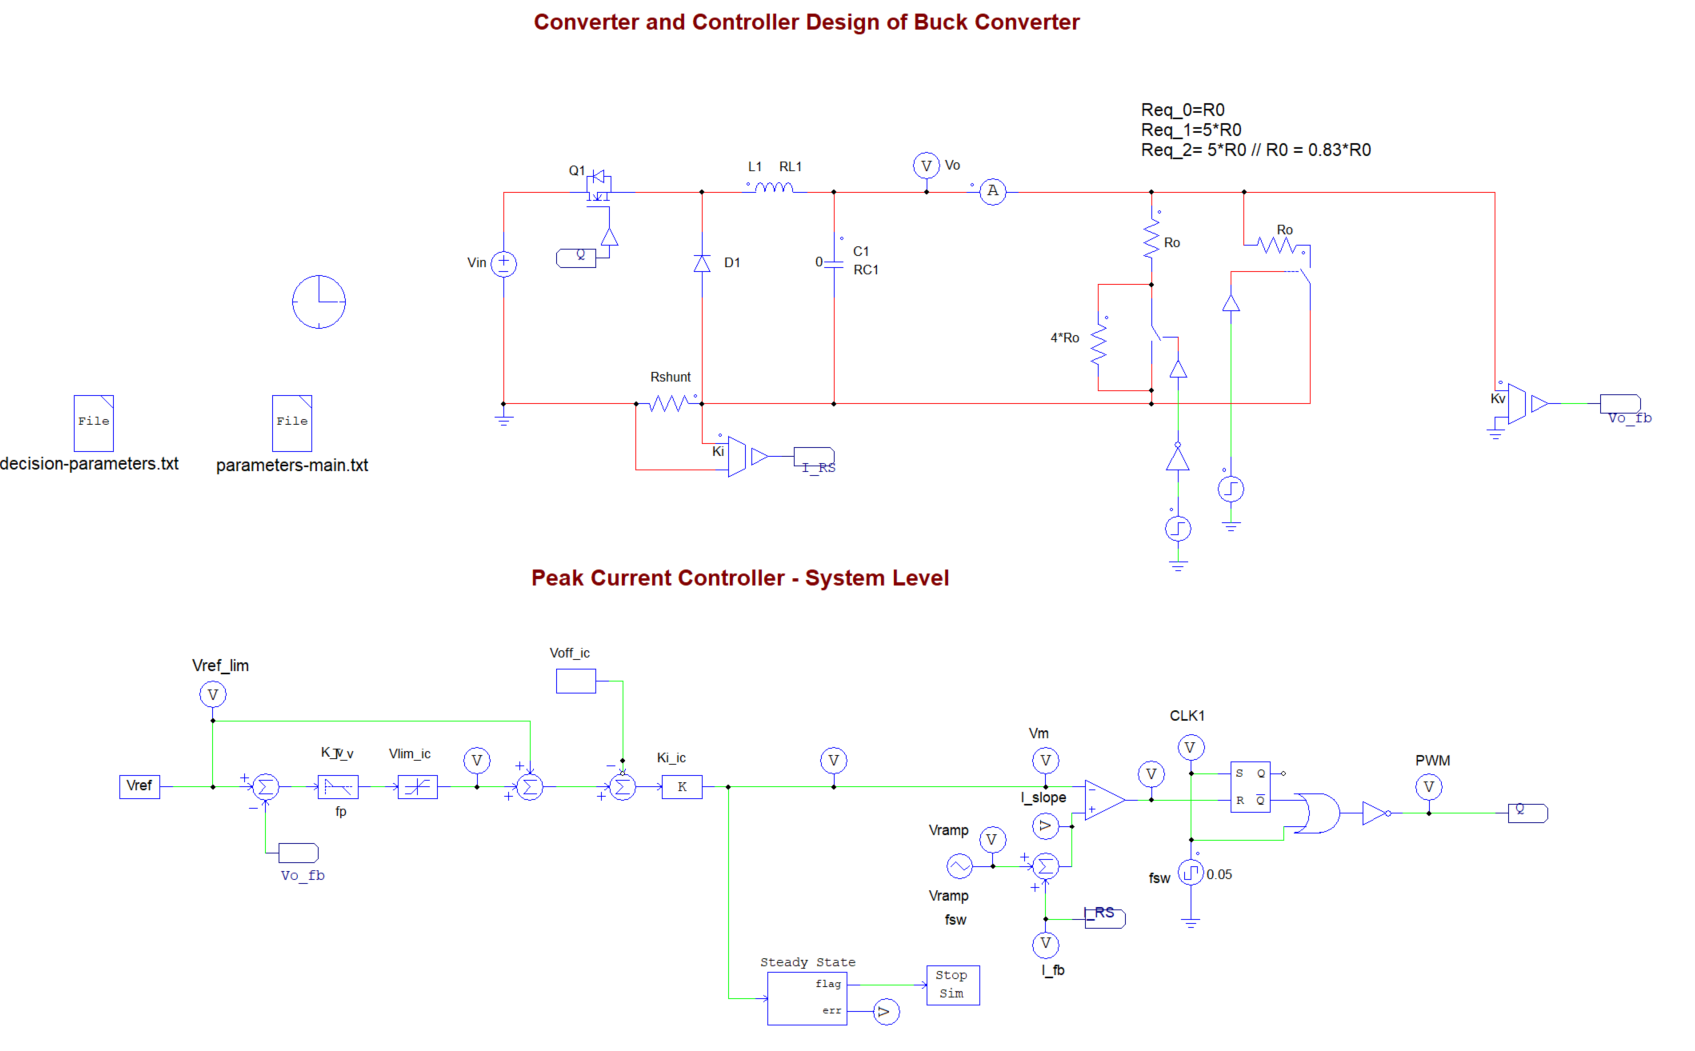
Req_0 = Ro → Pout = Po
Req_1 = 5*Ro → Pout = 0.2*Po
Req_2 = 0.83*Ro → Pout = 1.2*Po
Using these tricks, we make a buck converter’s operation analysis at different output power references.
Smooth PWM’s Duty Cycle Detection
One of the attributes that indicates a well - operated converter that uses PCMC, is the smoothness of the produced duty cycle. A PWM that doesn’t have a smooth duty cycle, indicates a bad control and it can’t be a solution when it comes to control the converter. For this reason, we have to find a way that sorts out a bad PWM from a smooth one.
On our occasion, we observe, using trial and error method, that the FFT of a PWM signal with a smooth duty cycle has a strong harmonic at the fundamental/switching frequency (200kHz), and more specifically its magnitude is more than 0.58.
For this reason, the parameters combination that leads to a PWM signal and its FFT magnitude at 200kHz is less than 0.58, is cancelled.
This PWM’s duty cycle detection may not be robust for every application, and everyone has to adjust the threshold when working on different applications. Of course, someone may be able to find a better way to automate this detection.
Optimization Problem
A problem that usually has to be mitigated, is the overshoot that appears in the attempt of reaching the reference output voltage. In this optimization problem we will try to minimize the voltage overshoot:
Decision parameters:
- Vramp : compensation slope (0.0111 - 0.42)
- K_v : voltage controller gain (0.25 - 6.75)
- T_v : time constant controller gain ( 5.25e-6 - 7.98e-5)
- fp : Pole frequency (200000 - 400000)
The default parameters combination is the [0.12, 1.2, 7.25e-5, 318309.89]
The compensation slope duty cycle is fixed and equal to “1“.
The switching frequency is at 200kHz.
Objective function:
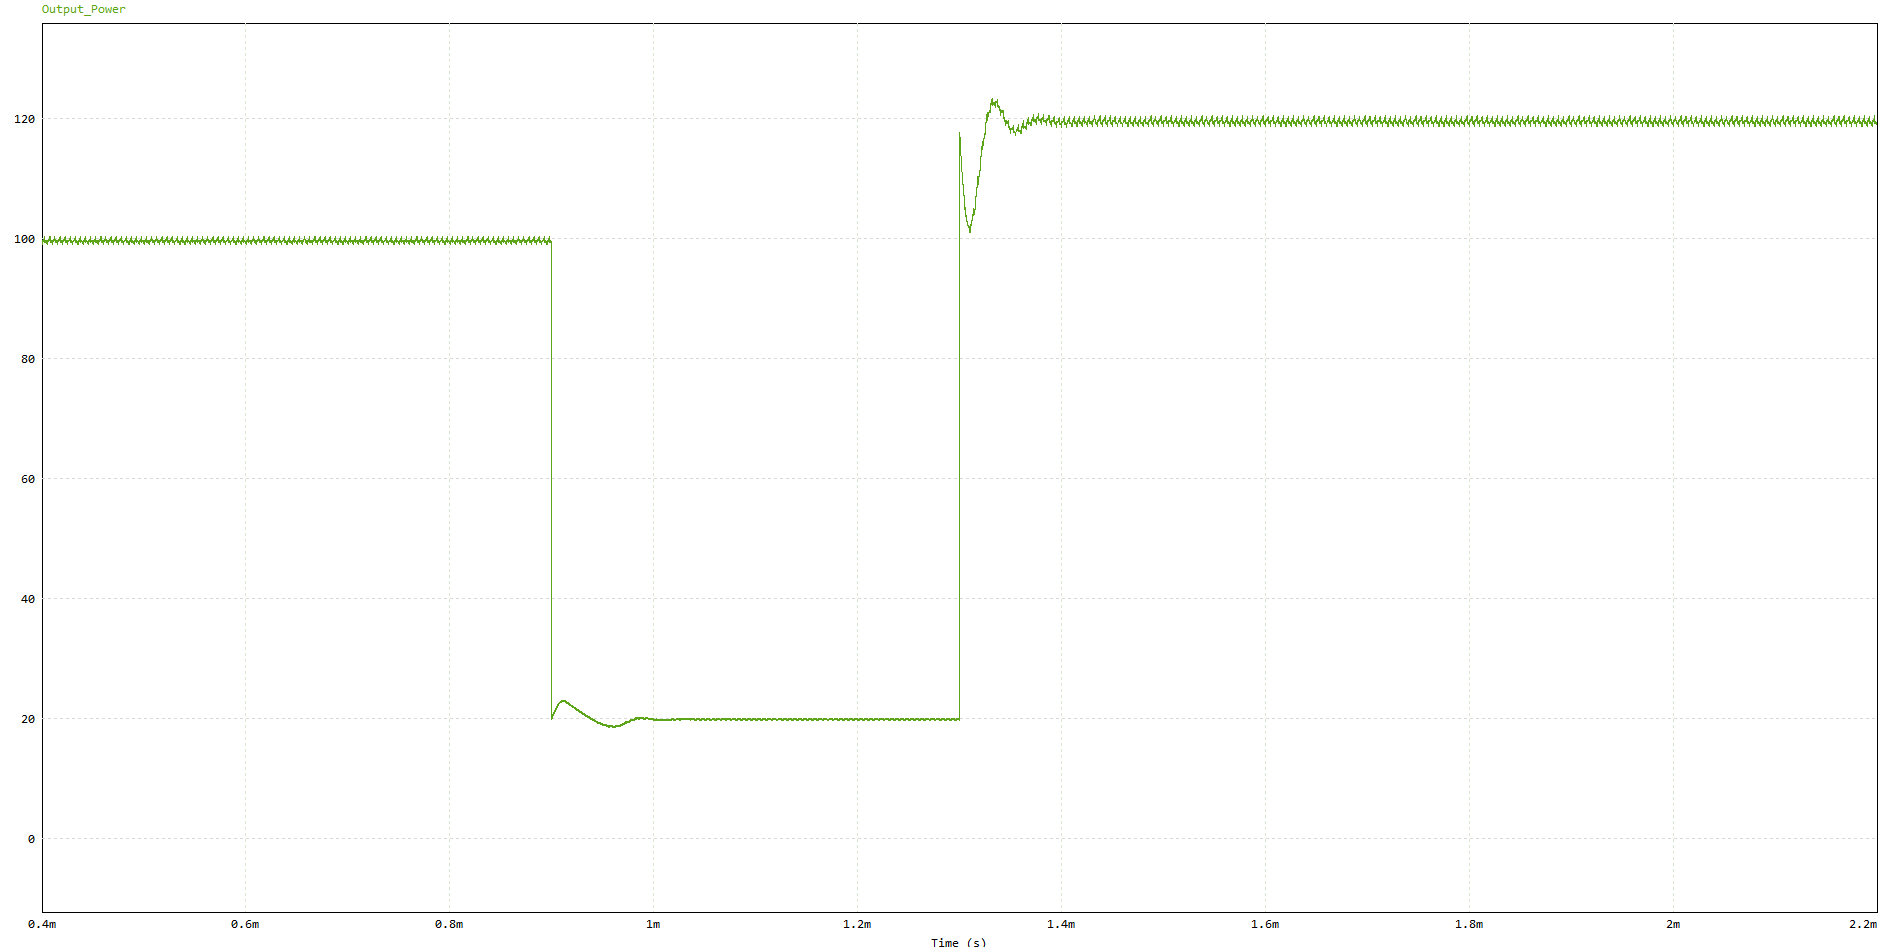
The output voltage can be separated in two transitions (Po → 0.2*Po, 0.2*Po → 1.2*Po). So, the output voltage Vo is separated in Vo_1 and Vo_2. The objective function is the overshoot and settle time of the Vo_2 and they have to be minimized.
Constraints
- FFT of the PWM signal must be more than 0.58
- Vo DC component must be in a range of [11.5, 12.5]
HyperStudy analysis
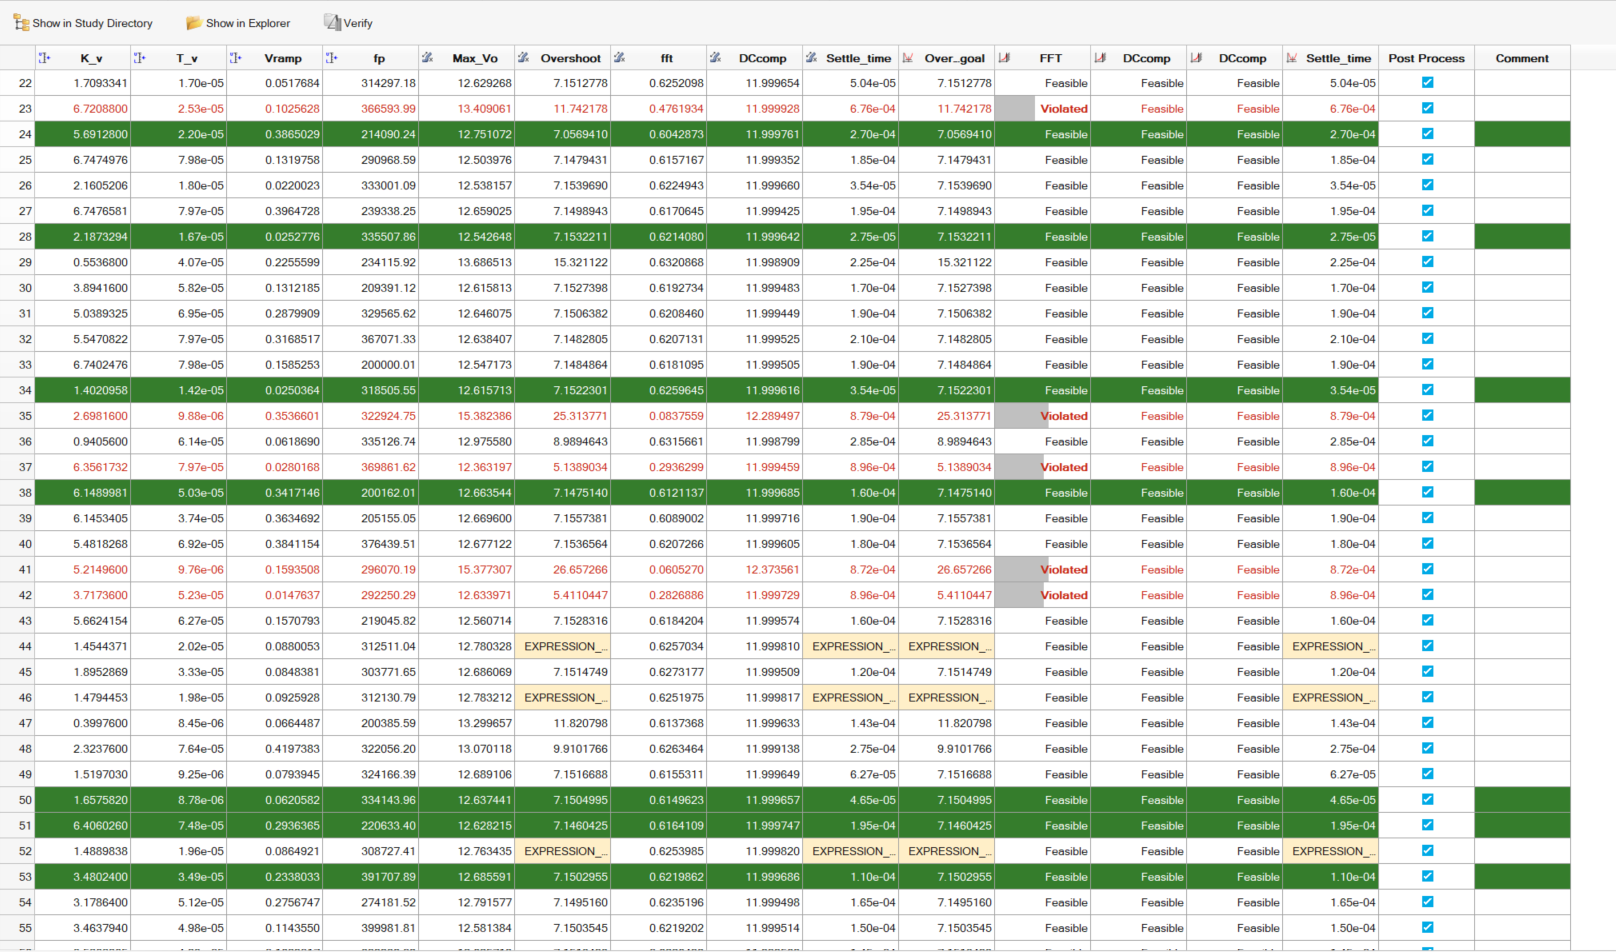
We run the optimization setup and we end up to more than one solutions, as we have two objective functions. So, the “green combinations“ lead to optimum results.
PSIM Validation
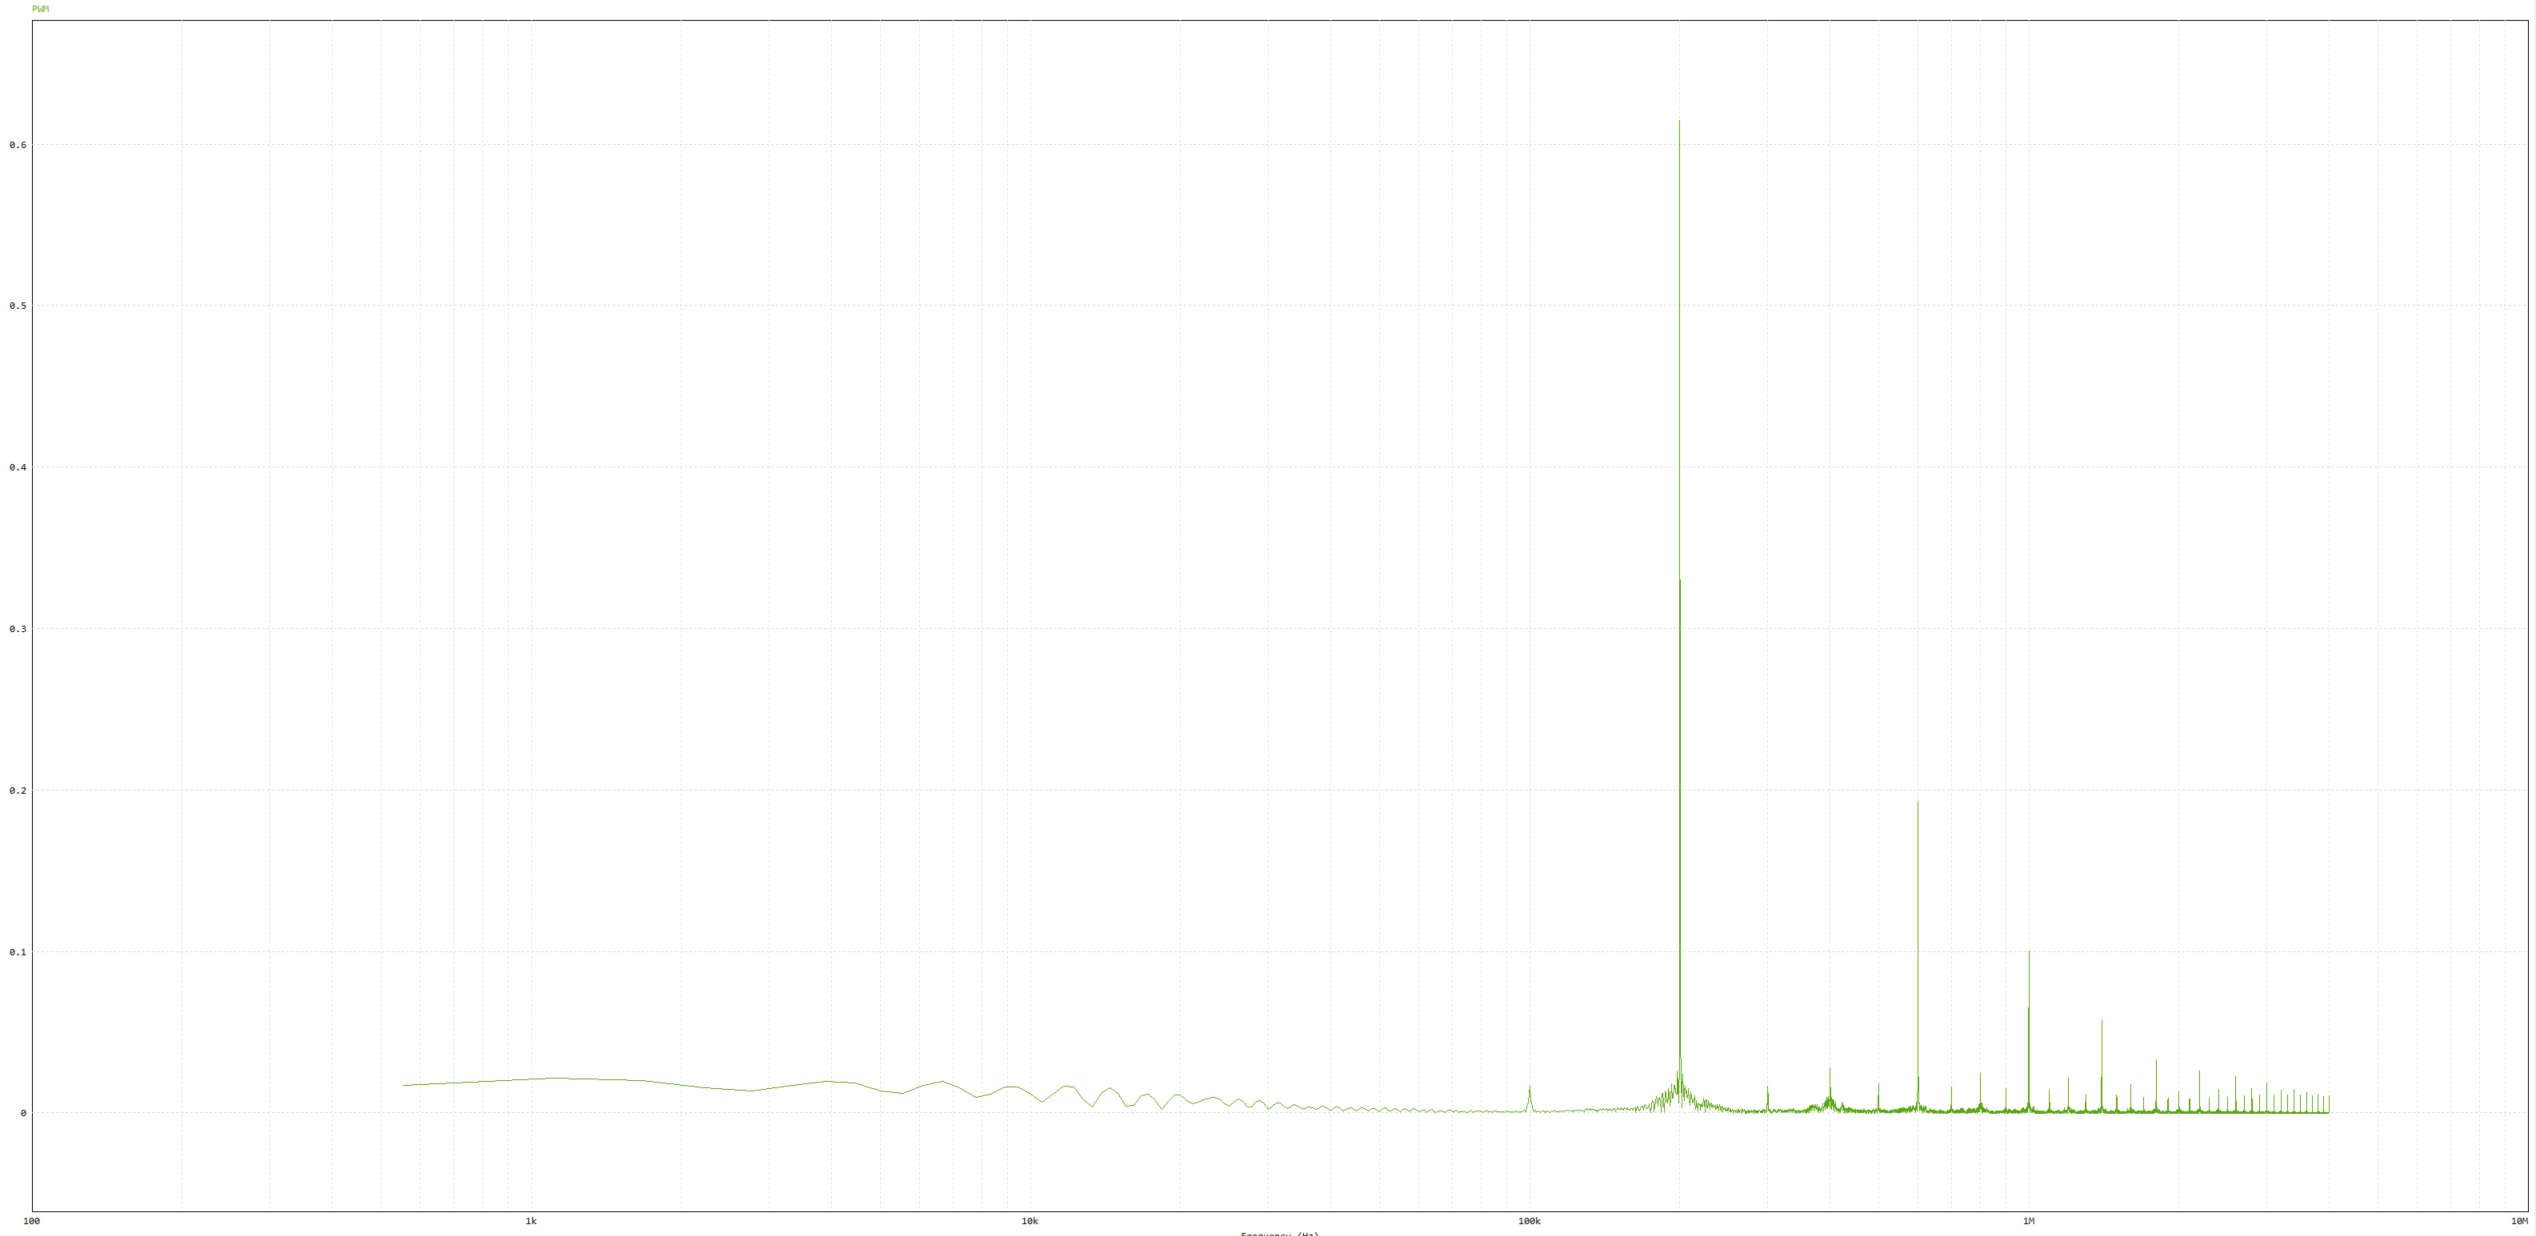
We are going to validate the 28th run by checking the results in SIMVIEW. The PWM is smooth and it is imprint to the output voltage too.
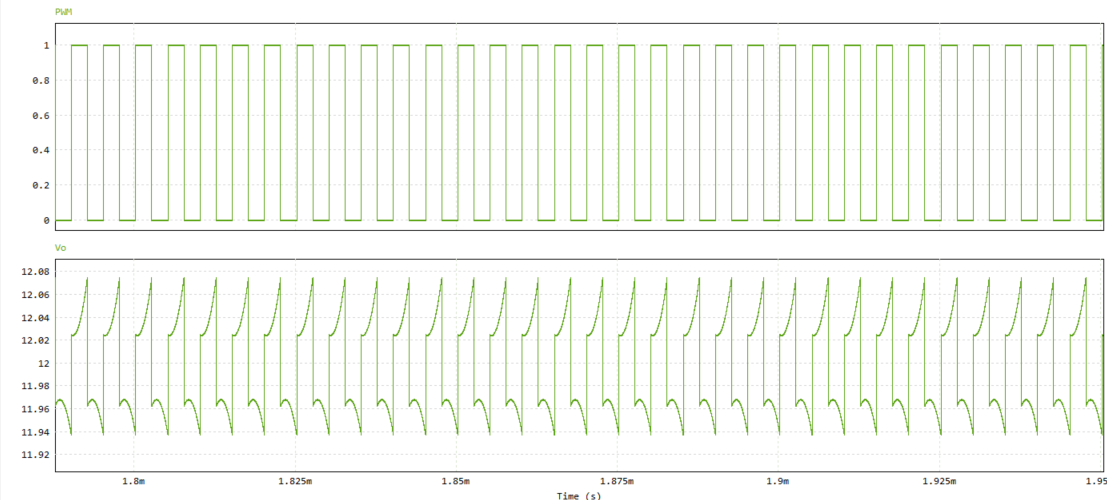
The output voltage is shown below
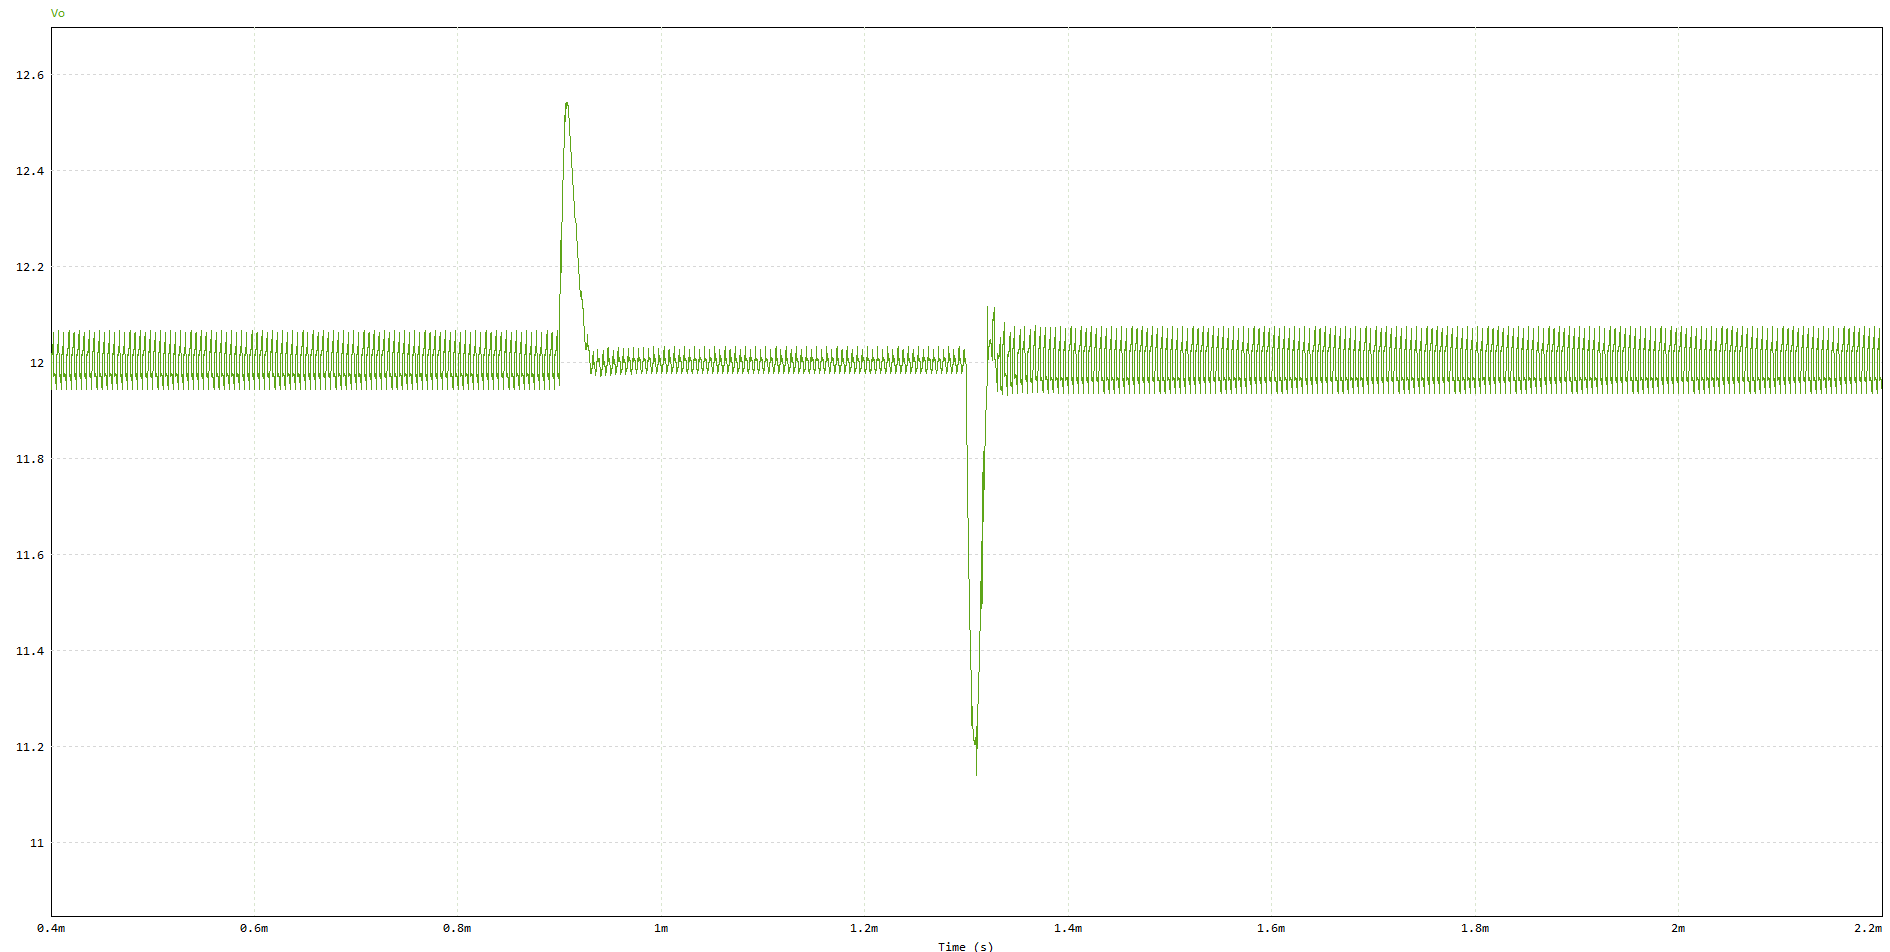
Remember that HyperStudy is a mathematical tool that finds solutions based on the constraints and objectives we define. For instance, the optimal solution from the 24th run might not be suitable for certain applications due to significant oscillations, as we haven't set a constraint to exclude this solution.
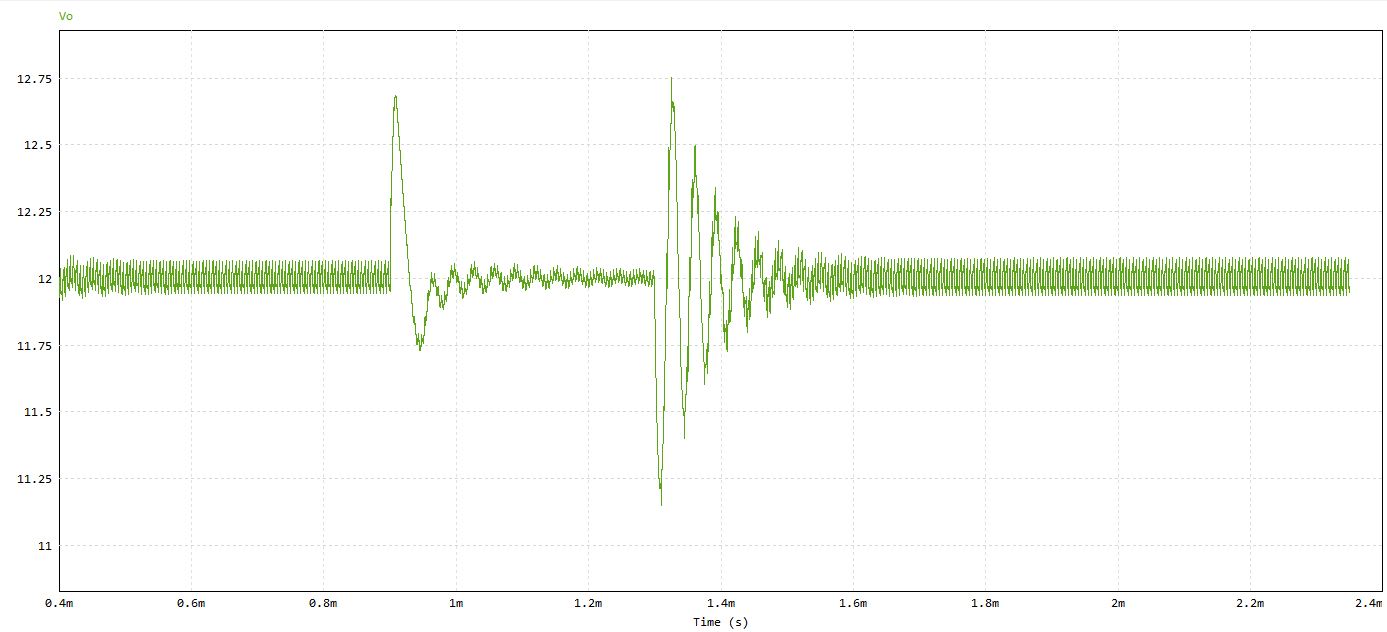
Therefore, it's essential to review the solutions that HyperStudy generates
Uploaded files:
Due to large data size, the HyperStudy analysis does not include the results. You can only view the optimal results and manually enter them into the PSIM parameter file.