Questions:
If the weight of a feature dramatically changes depending on the model used, the ranking of the 5 most important features are varying a lot between the models. Because these features have a context related to a patient population, and we believe that time onset to ER is very important, we really were looking for some more homogeneous results.
Next I would like to deploy and score (20%) the most resilient model. With my laptop having too low RAM, I got stuck in the final portion of the scoring.
Could some RM friends take a look at my data and show me some scoring results after deployment?
Dataset (attached as CSV)
The data used for model development was acquired from the local electronic health record system (HIX (version 6.1 HF96), Chipsoft, Amsterdam, The Netherlands) of the Ziekenhuis Oost-Limburg, Genk, Belgium. Following a database query, the data was de-identified resulting in patient data admitted with symptoms highly suggestive for stroke between January 2017 and February 2019 (n=796).
The features we are focused on are:
Sex, Age, Glycemia, NIHSS, Pre-Stroke mRS, Time Onset To ER, Dense Artery Sign, Diabetes, Early Signs of Ischaemia, History of Acute Stroke, Hypercholesterolemia, Obesity, Outcome Miserable, Smoking
Features characteristics of the entire dataset
Feature | Missing(%) | Infinite(%) | ID-ness(%) | Stability(%) | Valid(%) | Count (male) | Count (female) | Percentage (male) | Percentage (female) |
Sex | 0 | 0 | 0.25 | 51.38 | 48.37 | 409 | 387 | 51.4 | 48.6 |
Feature | Missing(%) | Infinite(%) | ID-ness(%) | Stability(%) | Valid(%) | Minimum | Maximum | Average | SD |
Age (years) | 0 | 0 | 6,66 | 1.76 | 91.58 | 25.20 | 97.61 | 73.23 | 13.23 |
Glycemia (mg/dl) | 5.03 | 0 | 20.60 | 2.25 | 72.12 | 45 | 413 | 128.53 | 42.81 |
NIHSS | 3.27 | 0 | 3.89 | 12.47 | 80.37 | 0 | 30 | 7.73 | 7.40 |
Pre-Stroke mRS | 4.77 | 0 | 0.75 | 51.45 | 43.02 | 0 | 5 | 0.94 | 1.24 |
Time Onset To ER (min) | 32.04 | 0 | 34.30 | 3.88 | 29.79 | 0 | 36202 | 272.4 | 1580.35 |
Feature | Missing(%) | Infinite(%) | ID-ness(%) | Stability(%) | Valid(%) | Count (yes) | Count (no) | Percentage (yes) | Percentage (no) |
Dense Artery Sign | 15,70 | 0 | 0.25 | 62.44 | 21.60 | 419 | 252 | 62.4 | 37.5 |
Diabetes | 0 | 0 | 0.25 | 75.38 | 24.37 | 196 | 600 | 24.6 | 75.4 |
Early Signs Of Ischaemia | 10.43 | 0 | 0.25 | 77.84 | 11.48 | 158 | 555 | 22.2 | 77.8 |
History of Acute Stroke | 0 | 0 | 0.25 | 55.28 | 44.47 | 356 | 440 | 44.7 | 55.3 |
Hypercholesterolemia | 13.32 | 0 | 0.25 | 55.36 | 31.07 | 308 | 382 | 44.6 | 55.4 |
Hypertension | 11.93 | 0 | 0.25 | 68.05 | 19.77 | 477 | 224 | 68.0 | 32.0 |
Obesity | 27.51 | 0 | 0.25 | 74.35 | 0 | 148 | 429 | 25.7 | 74.3
|
Outcome Miserable | 0.75 | 0 | 0.25 | 84.30 | 14.69 | 124 | 666 | 15.70 | 84.30 |
Smoking | 21.86 | 0 | 0.25 | 63.83 | 14.06 | 225 | 397 | 63.8 | 36.2 |
Anatomical localisation of stroke (number of patients, fraction of patients)(Missing: 8.79%; Infinite: 0%; ID-ness: 0.5%; Stability: 45.32%; Valid: 45.39%)
Distal | 329 | 0.45 |
Anterior | 236 | 0.33 |
No ischaemia | 99 | 0.14 |
Posterior | 62 | 0.09
|
Treatment ((number of patients, fraction of patients)(Missing:0%; Infinite: 0%; ID-ness: 0.5%; Stability: 65.20%; Valid: 34.30%)
Conservative | 519 | 0.65 |
Thrombolysis | 127 | 0.16 |
Thrombectomy | 89 | 0.11 |
Thrombolysis and thrombectomy | 61 | 0.08 |
Outcome (label)
Functional outcome of patients admitted for acute ischemic stroke was determined by the value of the modified Rankin Scale (mRS) score at 3 months. A label was generated by discretization of mRS scores into bins:
mRS scores of 5, 6 were labeled: “miserable”
mRS scores of 0, 1 or 2 were labeled: “favourable”
mRS scores of 3, 4 were labeled: “intermediate”.
Our interest focused primarily on patients with a favourable and with a miserable outcome respectively quantified by Modified Rankin Scales 0 - 2 and 5, 6.
The analysis is classification: non-miserable with interest in miserable class


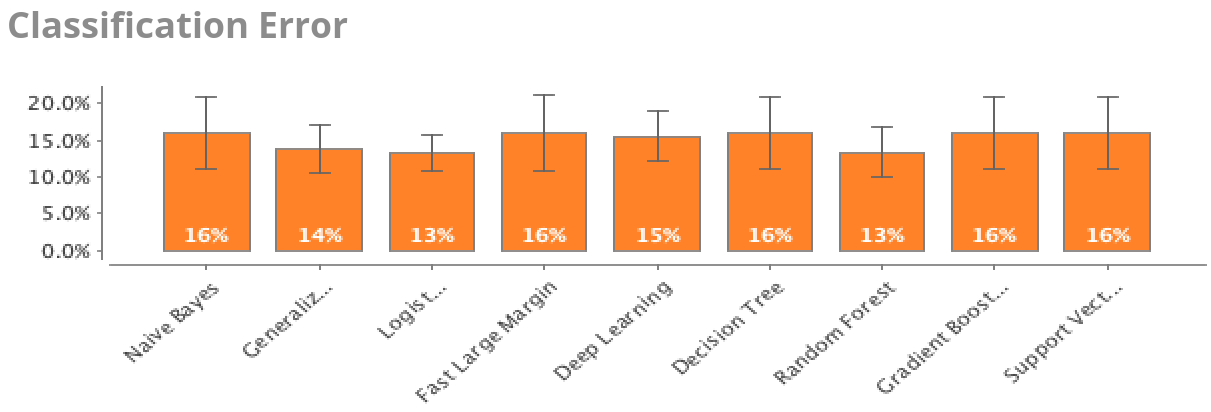
Model | Classification Error | Standard Deviation | Gains | Total Time | Training Time (1,000 Rows) | Scoring Time (1,000 Rows) |
Naive Bayes | 0,2 | 0,0 | 0,0 | 46301,0 | 253,2 | 4224,7 |
Generalized Linear Model | 0,1 | 0,0 | 10,0 | 55190,0 | 341,8 | 2389,2 |
Logistic Regression | 0,1 | 0,0 | 12,0 | 41313,0 | 183,5 | 2632,9 |
Fast Large Margin | 0,2 | 0,1 | 0,0 | 31927,0 | 349,4 | 1651,9 |
Deep Learning | 0,2 | 0,0 | 2,0 | 38505,0 | 1941,8 | 1259,5 |
Decision Tree | 0,2 | 0,0 | 0,0 | 25352,0 | 108,9 | 1107,6 |
Random Forest | 0,1 | 0,0 | 12,0 | 89713,0 | 289,9 | 1955,7 |
Gradient Boosted Trees | 0,2 | 0,0 | 0,0 | 130128,0 | 364,6 | 1145,6 |
Support Vector Machine | 0,2 | 0,0 | 0,0 | 136227,0 | 1191,1 | 4604,4 |