A program to recognize and reward our most engaged community members
Dear All,
Currently i am doing an aerodynamic CFD analysis of an aircraft wing using Acusolve .My problem is i am unable to plot the pressure, velocity, CL/CD graph plot in Acuprobe
Kindly provide your valuable guidelines
Thanks & Regards
Ramganesh
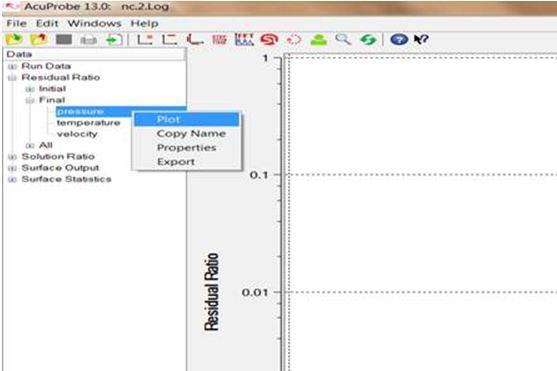
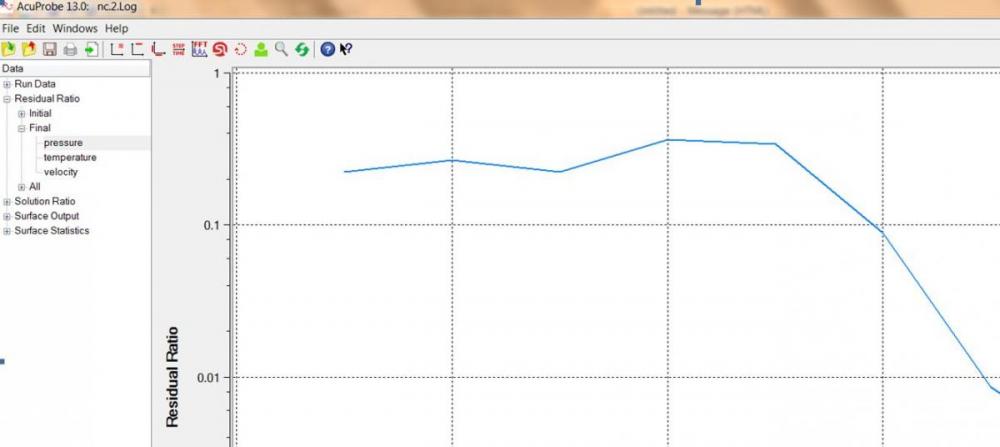
You just have to right click and then click plot, see images below
<?xml version="1.0" encoding="UTF-8"?>
If you are looking for contour plots, vector plots, etc, those would be created in AcuFieldView rather than AcuProbe.
Hi,
I have run a simple pipe flow problem in steady state. I would like to plot pressure vs flow rate.
I would like to do that using Acuprobe. I would export pressure , velocities and area from acuprobe, calculate flow rate and do the plot in Excel.
However, I am confused on which values to export - Solution Ratio/Surface Statistics/Surface Output.
Also there are initial, final and all; minimum and maximum for both pressures and velocities and I am getting confused.
Can someone guide me on this.
Also, can I directly plot this in Acufieldview?
Thanks
Hi, I have run a simple pipe flow problem in steady state. I would like to plot pressure vs flow rate. I would like to do that using Acuprobe. I would export pressure , velocities and area from acuprobe, calculate flow rate and do the plot in Excel. However, I am confused on which values to export - Solution Ratio/Surface Statistics/Surface Output. Also there are initial, final and all; minimum and maximum for both pressures and velocities and I am getting confused. Can someone guide me on this. Also, can I directly plot this in Acufieldview? Thanks
Residual Ratio and Solution Ratio track/report/measure the convergence levels of the equations being solved. Residual Ratio - a measure of how well the solution matches the equations being solved. Solution Ratio - a measure of how much the solution changes from iteration to iteration or from time step to time step. The initial/final/all values are only for these quantities - initial reports the first pass through the equation set, final reports the last pass, and all reports all passes. By default during a steady state run the equation set only has one pass each time step, so initial, final, and all would be the same.
Surface Statistics reports the min/max/average/standard deviation of the quantities on the various surface sets - as you'll see when you expand the various tree items under the surface sets.
Surface Output - these are the integrated/average quantities on a surface set, and you can see the various available quantities when you expand the tree items. These are most likely the quantities you would use for your reporting. For example, if you're looking for pressure drop from inlet to inlet, you would take the surface-output pressure difference between the inlet and outlet - and typically using the final values (from the last time step) from the run, for steady state.
You would use AcuFieldView (or HyperWorks CFD Post) to make contour, vector plots on surfaces, cut-planes, etc.
The tutorials included with the Help system will give you some good ideas as well.