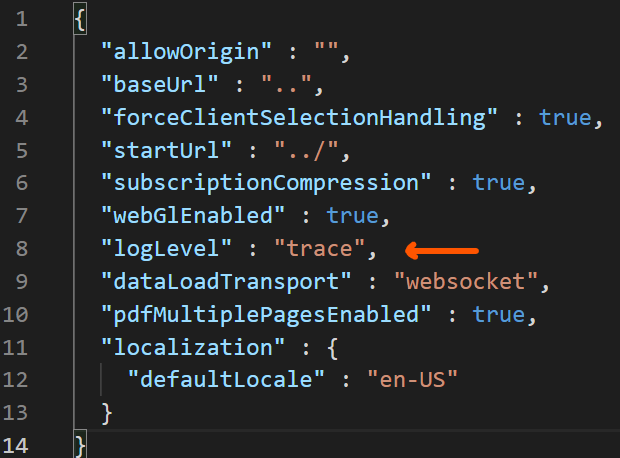
You don't need to restart your server for the configuration to take effect.
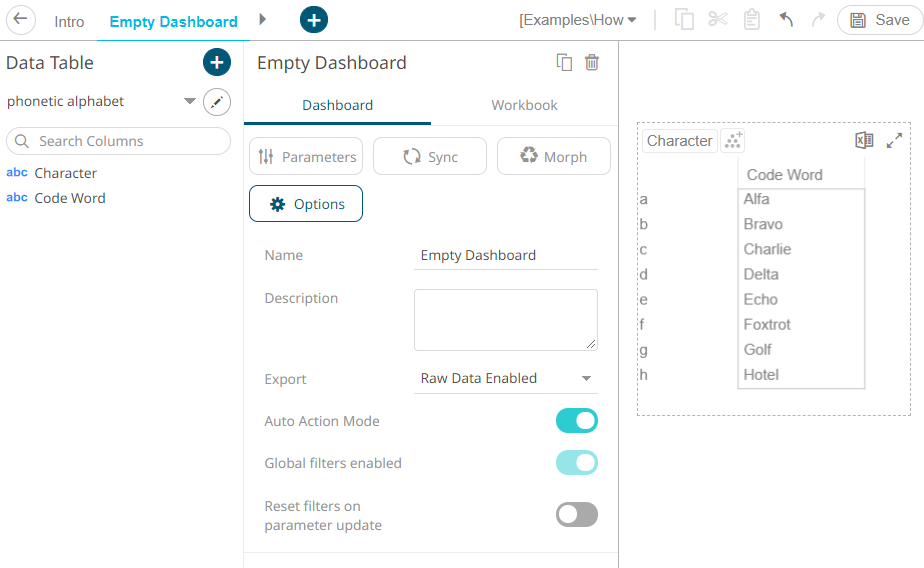
Next, we'll need to check how Panopticon builds the dataQuery object. Make a new empty dashboard put just one component on it so that we can isolate the dataQuery object we're interested in. As an example, I've added a single table:
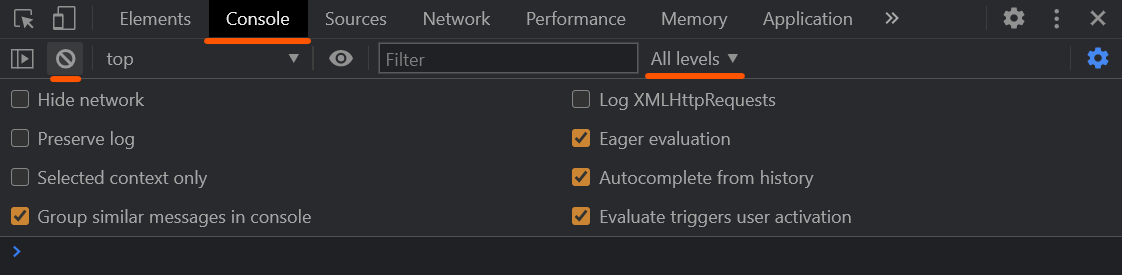
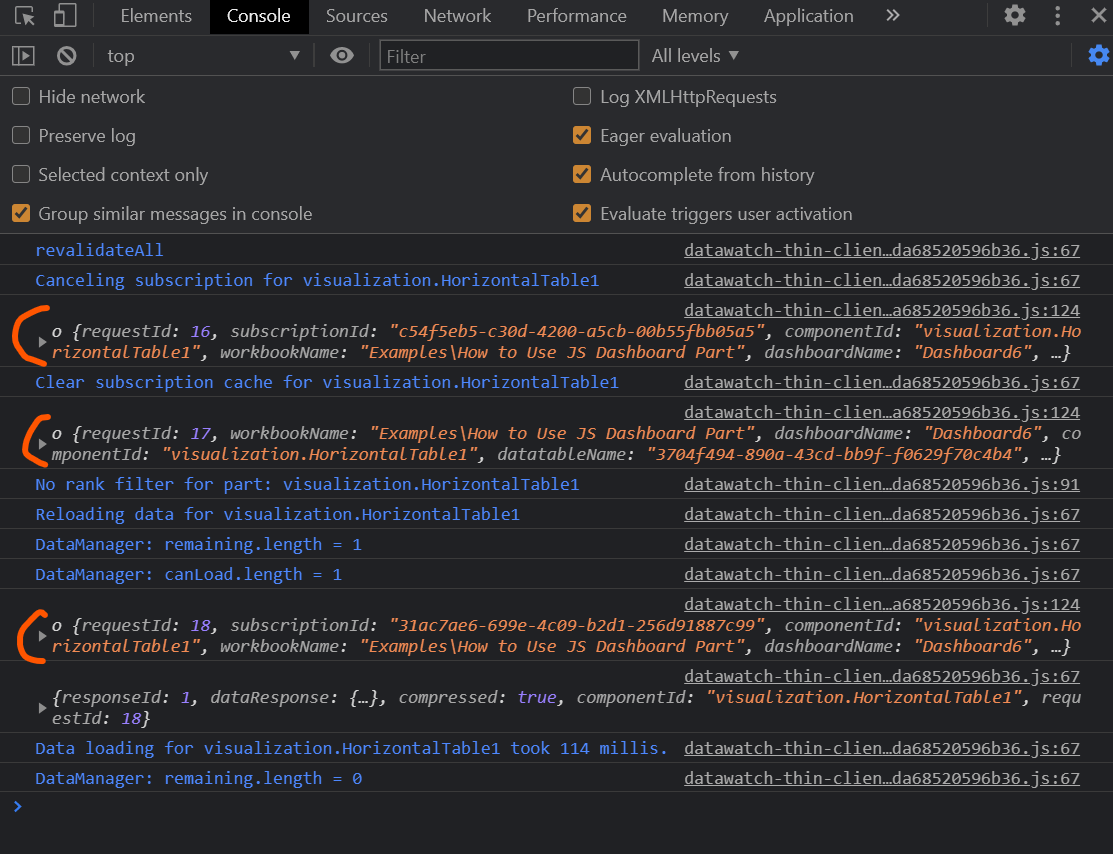
Now, we can check what our dataQuery object looks like. In this example, I'm using Google chrome. Open up the chrome developer console (F11 or right click > inspect) and navigate to the console tab. Make sure to change the logging level to "All levels", then clear the console.
Now, refresh the Dashboard (not the browser itself) and check the console. I've highlighted the objects that we're interested in.
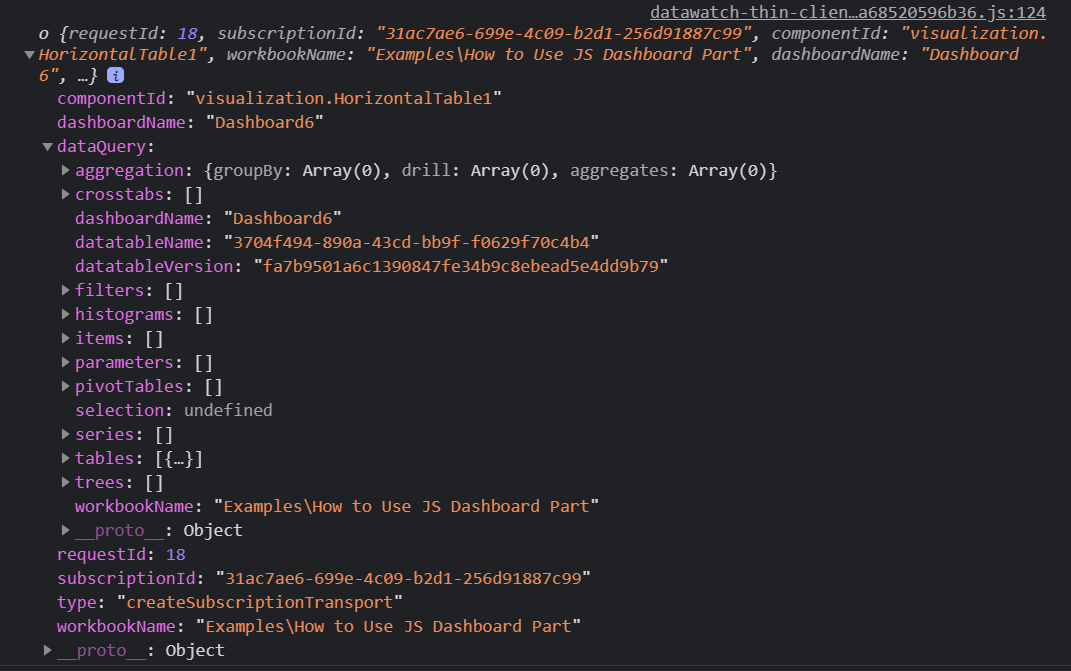
We can have a poke around the object itself.
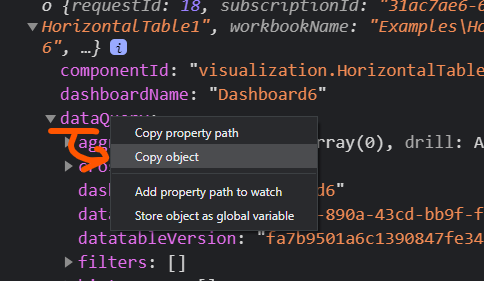
To actually use our new dataQuery object in our javascript part, we'll have to do a bit of work. We can copy the object to our favorite text/code editor by first right clicking the dataQuery object in the console and copying it.
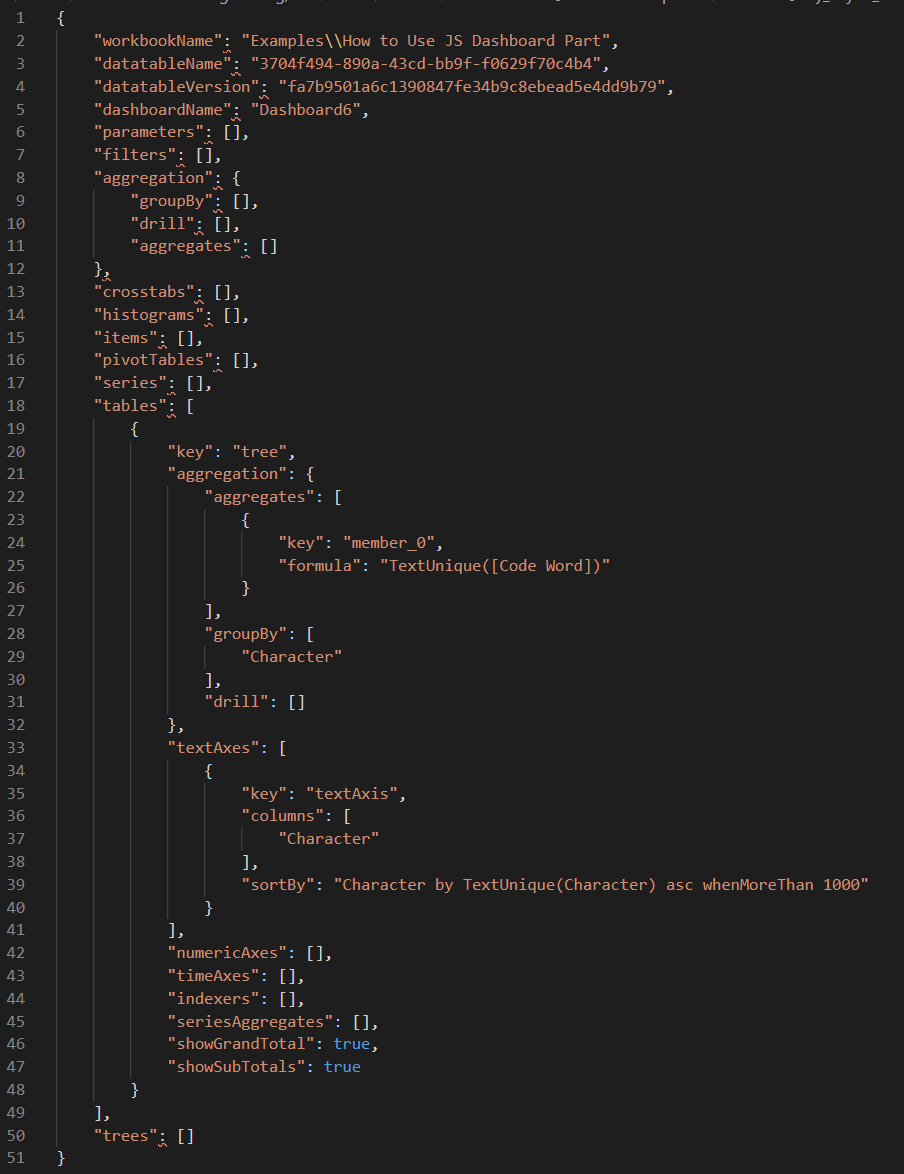
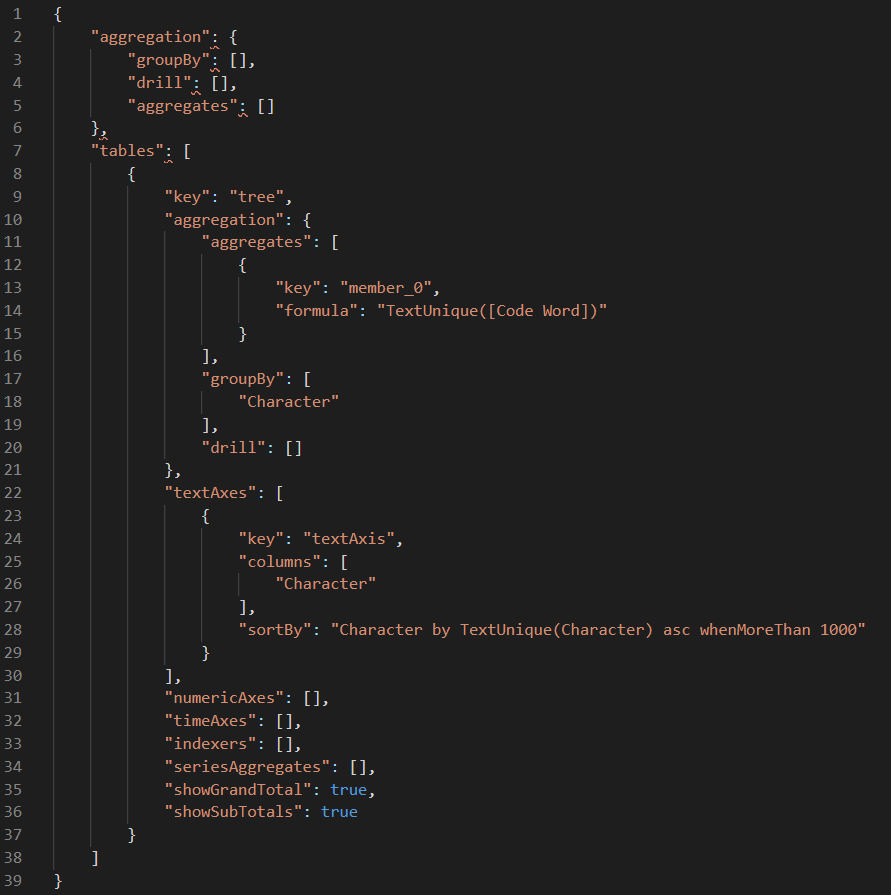
This is what the copied dataQuery object looks like in VSCode:
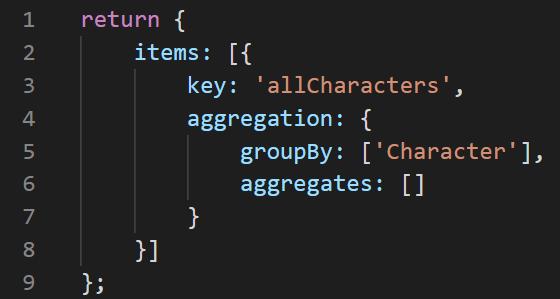
Now, we can remove attributes we're not interested in. The attributes workbookName, datatableName, datatableVersion, and dashboardName will be provided by Panopticon, so we can remove those.
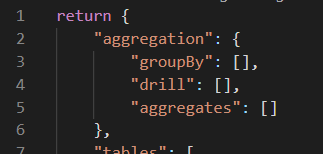
The final step is to put return in front of our dataRequest object.
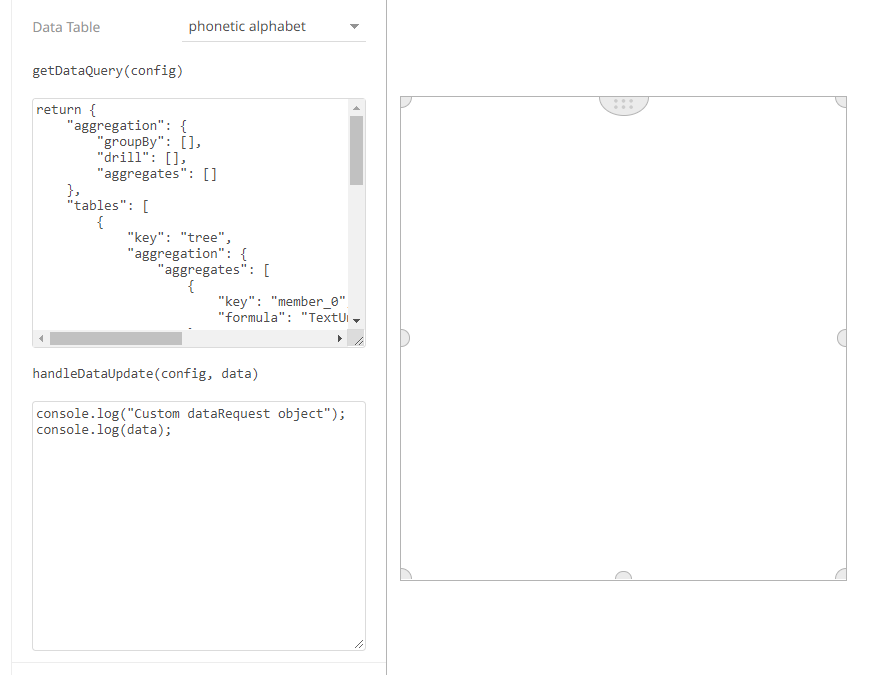
Now, we have a fully built dataRequest object that we can use in our Javascript part. To test it, let's add it to a JavaScript part and add some logging.
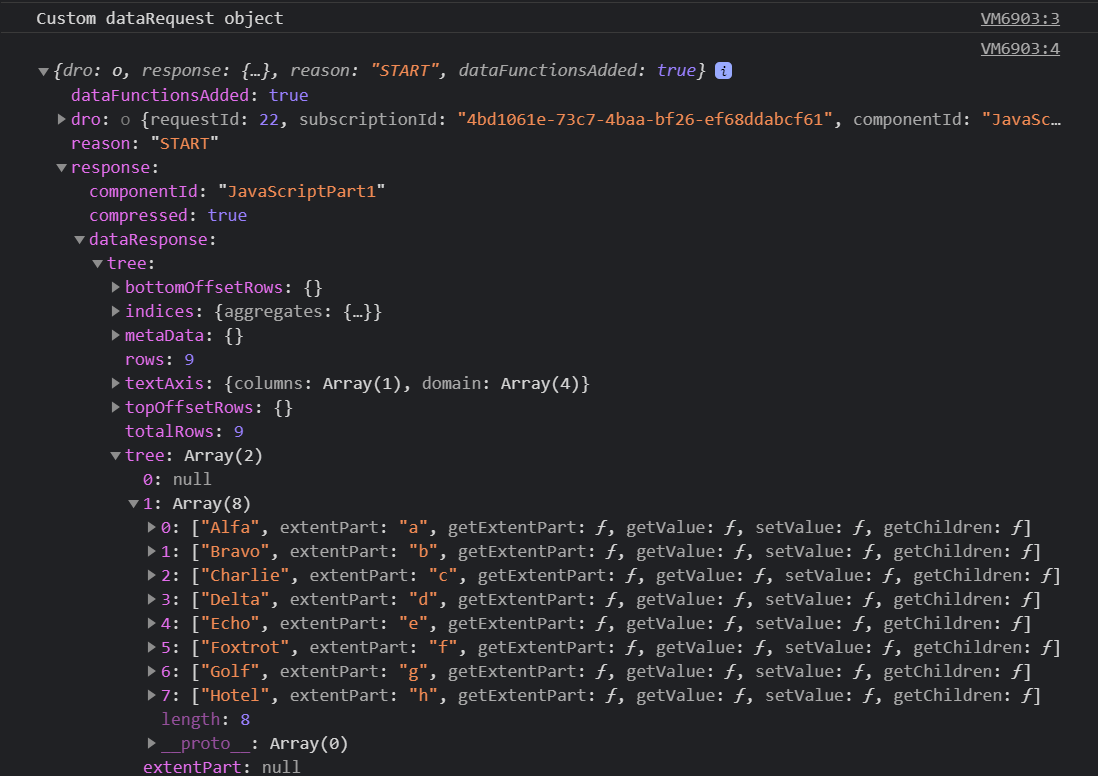
Now to view the dataResponse object that's returned:
And that's it! We can now use data directly from the Panopticon server to influence our JavaScript part.