Hi,
My time data setting is as follows.
Time step is 0.001 sec, Time range for analysis is 0~1.5 sec. (=> the number of time data is 1500)
I use the 'Freq' and 'FFTmag' function in HyperGraph.
The frequency data range is 0~499.51171875Hz and the number of the frequency data is 1024.
(I attached the time and frequency files in .csv format.)
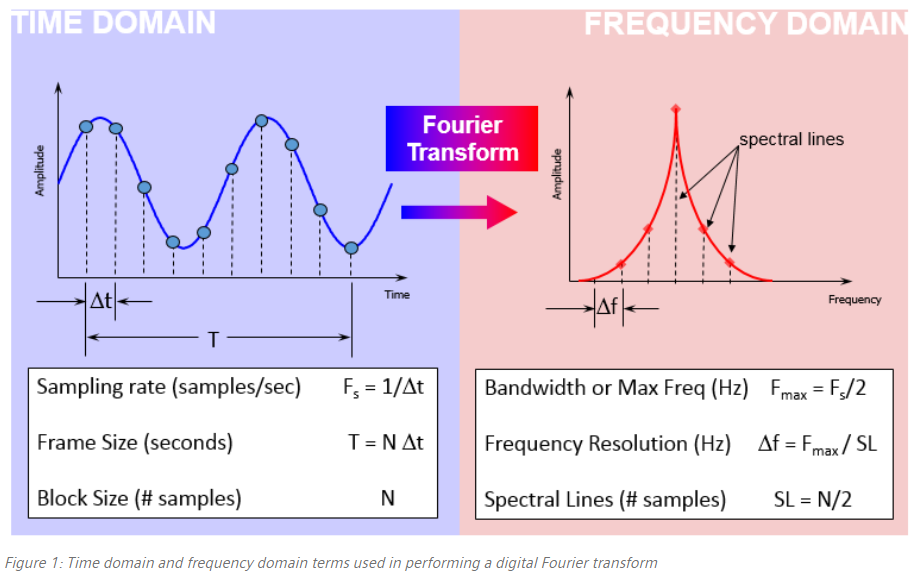
According to the figure,
Time step, Δt= 0.001 -> Bandwidth or Max Freq , F_max = 500Hz
the number of time data, N = 1500 -> Spectral line, SL = 750
I think Frequency resolution(Δf) should be F_max / SL = 500/750 = 0.6667Hz.
But in my data, frequency resolution is about 0.488Hz.
I don't know why.
What is the formula of 'Freq' and 'FFTmag' in HyperGraph?
Thanks.
![]()

Unable to find an attachment - read this blog