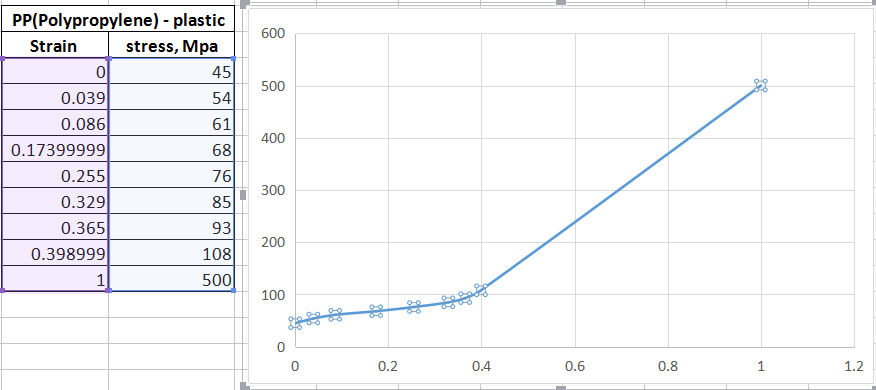
Stress strain curve for Plastic

Karthic_22061
Karthic_22061 Altair Community Member
edited October 2020 in Community Q&A

Hi,

I am having a doubt in the stress strain curve for a PP(Plastic)

From the attachment, the strain at 108 Mpa is 39.98 %, is this strain at Uts?   If so why the next data point 500 Mpa at 100 % strain is used ?


I don't understand the purpose of the data point  500 Mpa at 100 % strain. Please Clear my doubt


Thank you in Advance


<?xml version="1.0" encoding="UTF-8"?>PP stress strain curve.PNG
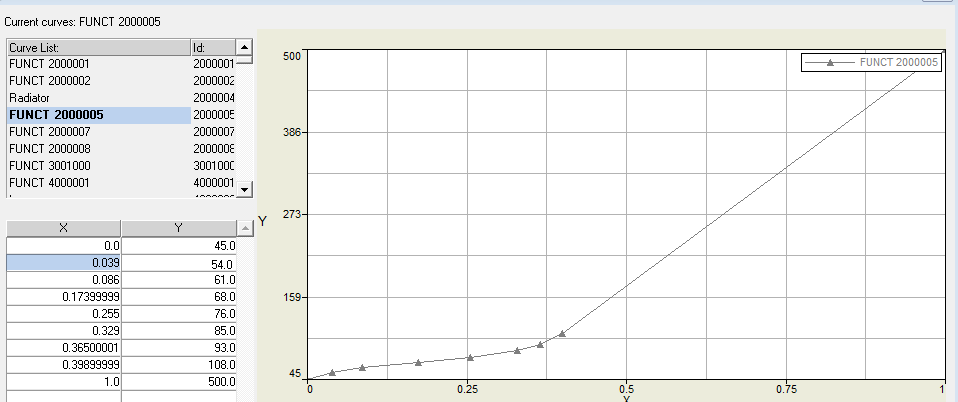
<?xml version="1.0" encoding="UTF-8"?>Capture.PNG

Tagged:

Answers

  • Altair Forum User
    Altair Forum User
    Altair Employee
    edited March 2018

    Hi Karthic,

    From the curve above, the yield stress is 45. When we represent the curve the first point of the function should have a plastic strain value of 0.

    And the stress-strain values are rising gradually. After a stress value of 108, user is providing 500 and these values shows that as the load is indefinitely increased (in this case 500) the material will strain to its maximum. In short the breaking point is at 500, and will material will strain up to maximum in between 108 and 500. The solver itself interpolates the stress-strain values in between these points (108 to 500 for strains .398999 to 1)

  • Karthic_22061
    Karthic_22061 Altair Community Member
    edited March 2018

    Hi George,

    Thank you for the quick response,

    So you mean that till 108Mpa is the actual test data and 500 Mpa is just user feed ?


  • Altair Forum User
    Altair Forum User
    Altair Employee
    edited March 2018

    Hi Karthic,

    It seems so. User will provide a value so that the solver will interpolate within this, and we are also sure that normally the load will not go up to this range.