AcuFieldView Postprocessing


Hello,
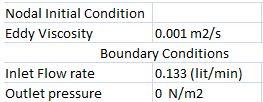
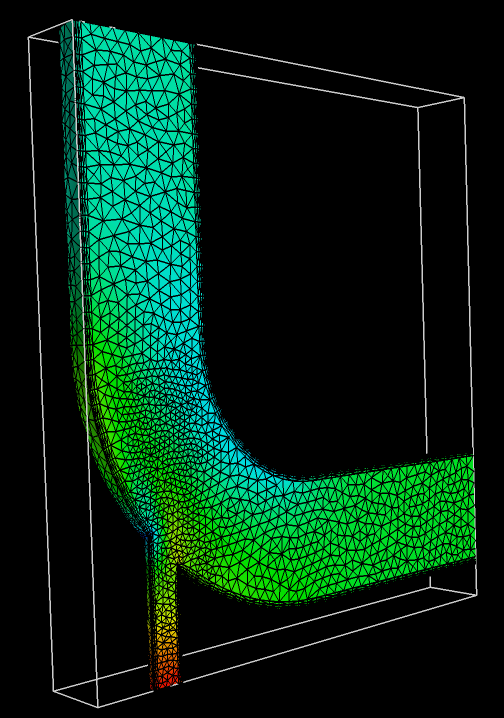
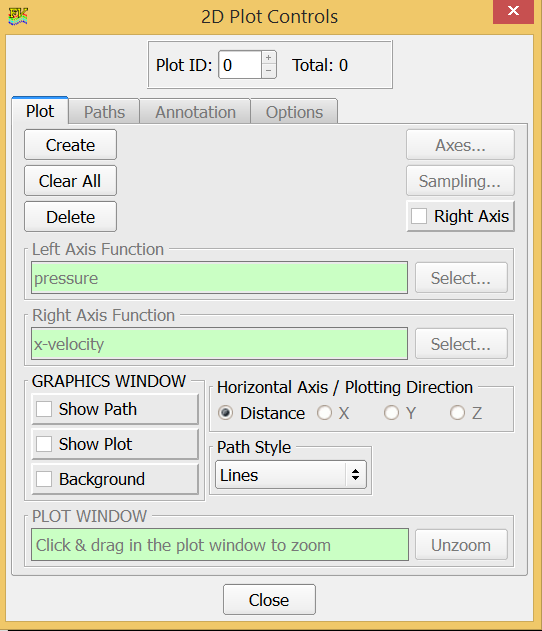
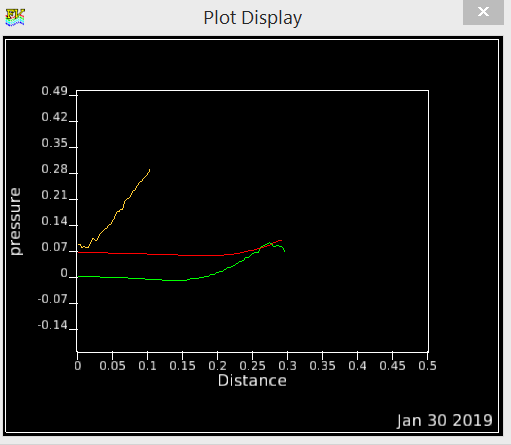
I am trying to estimate the backpressure in an exhaust muffler with input as flow rate in lit/min corresponding to the engine speed and outlet BC as pressure. I am new to CFD analysis, so I would like help on how to check pressure drop result in AcuField view. I find it a bit difficult to understand the user interface of AcuField view. I have uploaded a snap of my Boundary condition below.
Thanks,
Srivatsan
Answers
-
Hi Srivatsan!
You can examine the pressure drop in your model by looking at the pressure contours and also by creating 2-D plots of the pressure variation along a plane in a particular dimension. You may also use a probe to get the exact pressure value at a particular point.
An example for examining the pressure by each of the three methods listed out is given below.
- Once your simulation is complete in AcuSolve (in the AcuConsole environment, you can directly launch AcuFieldView by clicking on the marked icon on the toolbar at the top of the window.
<?xml version="1.0" encoding="UTF-8"?>
- Once you're inside the AcuFieldView environment, you should be able to view your model.
<?xml version="1.0" encoding="UTF-8"?>
- Next, go to the 'Bound' option on the menu on the toolbar of the left hand side of the interface. A window will pop up where you may specify the scalar function to be pressure. Upon doing this you would be able to view the pressure contours of your model. (Ensure that all surfaces are selected for getting the entire model's picture)
'Bound' or Boundary Surface Window Pressure Contours
<?xml version="1.0" encoding="UTF-8"?>
- For a 2D Plot, again go to the 'Bound' Menu and deselect all the planes except the symmetry plane. (for viewing the pressure variation at the symmetry plane).
- Next, go to the 'Plot' option on the left hand side toolbar. A window as shown below pops up. Select 'Create'.
- Next, the tab 'Path' will open. Pick Create> Line Path (Surface)> Pick the start and the end point to get the variation of pressure on the plot. Make sure that the 'Left Axis Function: in the 'Plot' tab is pressure.
2D Plot Variation
- You may also use the 'Probe' option on the left side menu to measure the pressure at any specific point.
Hope this helps.
/emoticons/default_smile.png' srcset='/emoticons/smile@2x.png 2x' title=':)' width='20'>
0 -
Hi Nimisha,
Thank you for your inputs shall try as you outlined.
0 -
You can also refer to the AcuFieldView tutorials that come with the installation. From AcuFieldView: Help > AcuSolve Help Home Page > Tutorials > Altair AcuFieldView Tutorials. There you have three tutorials: AFV-T: 1000, 2000, and 3000.
You can also use AcuProbe, initially covered in some of the main AcuSolve tutorials, such as under Turbulence > ACU-2100. This allows you to see/track integrated values of quantities like pressure on the various boundary surfaces.
0 -
Hi Everyone,
I am new to Acusolve and I have started using HW CFD Workflow V2020. I would like to know how to export .fvuns files from HW CFD to use in AcuFieldView.
Regards
VL
0 -
Vignesh Lakshmanan said:
Hi Everyone,
I am new to Acusolve and I have started using HW CFD Workflow V2020. I would like to know how to export .fvuns files from HW CFD to use in AcuFieldView.
Regards
VL
HW CFD 2021 has much better integrated post-processing versus 2020, so you may be able to do what you need in HW CFD 2021.
Otherwise, you'll need to use the AcuSolve Command Prompt to convert the results to fieldview format. Generally:
acuTrans -out -to fieldviewplus other options needed. See the Programs Reference Manual for more details on acuTrans and/or
acuTrans -hfor usage.
1