Hi there. I got a problem, i want to plot the amplitude of a simple spring-mass-system in HyperGraph.
The problem is, i don´t know which load steps or control cards i have to define.
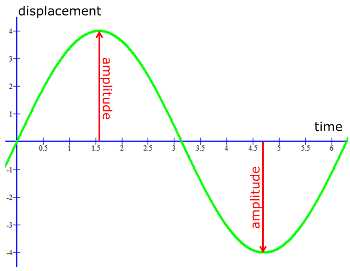
This is an example how it should look like:
I need to know how to do that because in the next step, i have to design a
spring-damper-system to visualize the damping with HyperGraph.
I would any appreciate any help of you.
Greetings
