how to interpret the enegry curve obtain through time history file

Altair Forum User
Altair Forum User
Altair Employee
edited October 2020 in Community Q&A

I have time history of nonlinear dynamic analysis file to hypergraph and the various energy curves w.r.t time.
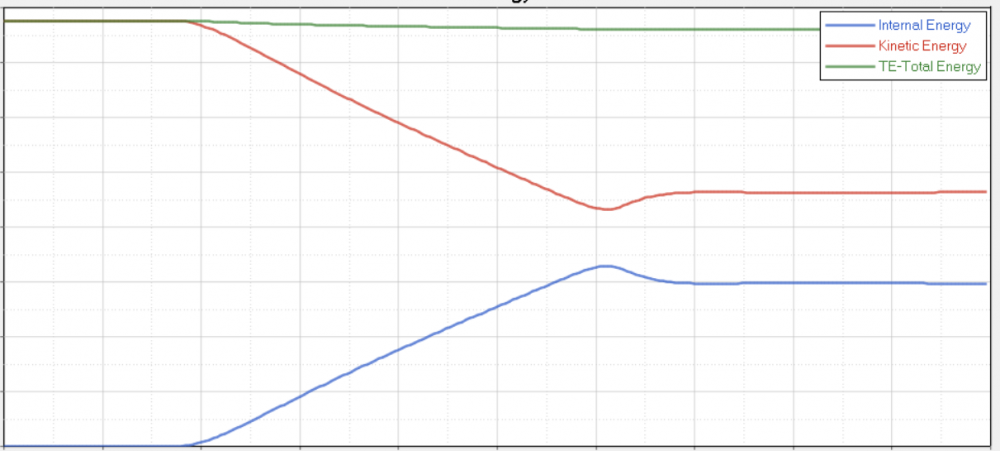
I am unable to interpret energy curves like ( total energy, kinetic energy, internal energy, hourglass energy) 
How could I get confirm if my simulation results are correct by the means of these curves.


One more thing, in many FEA books (such as practical aspects of FEA) they talk wrt Potential energy but there are no such plots for potential energy in global variables.


Please suggest me to reach to the conclusions.

Answers

  • Altair Forum User
    Altair Forum User
    Altair Employee
    edited April 2018

    Hi,

    The energy plots of a run gives the energy conservation of the system during the run.

    For every run you should always monitor the energy plots. Any unprecedented behavior of the model can be traced from the energy plot, like a sudden jump in energy plots or high contact energy, hourglass energy...etc. These helps the users to know whether the simulation they are running is valid or not.

    For a case like crash test you can cross check the kinetic energy plot value with hand calculation and can confirm whether the plots are fine. KE can be found with 1/2 mv2 and the same value should be the starting point for KE plot. These cross checks helps to validate the simulation. 

    The internal energy shows the energy absorbed by the object upon impact, nothing but the strain energy. For a crash test, the KE will reducing and proportionally the IE will be rising showing that the shock upon impact is absorbed by the material/part. This is how we interpret the energy plots. Similarly for drop test and other cases.

    Total Energy=IE + KE + RKE + CE + HE (RKE-Rotational kinematic energy, CE-Contact ENery, HE-Hourglass Energy) and the total energy must remain constant or can decrease very slightly.

    And so checking simulation's energy balance plays an important role in every simulation. 

    The plot below shows a typical global energy plots for an impact case.

    <?xml version="1.0" encoding="UTF-8"?>plot.PNG


    Hourglass is weird modes of deformation that occur in under integrated elements and no stresses will be produced. This can affect solution accuracy by varying the structure’s true response. This leads to inaccurate stress, strain and deflection results. From the time history file (T01) we finally plots hourglass energy of the system and typically it should be less than 10% of the total energy. If high hourglass energy (HE) is found, we will create HE plot separately for each component and will find which component is contributing for this high HE and will take the control measures.


    The kinetic energy of an object is the energy that it possesses due to its motion. It is defined as the work needed to accelerate a body of a given mass from rest to its stated velocity and in explicit cases we does the same thing as we consider inertia. If you consider a case like drop test, at the instance of where the object meet the ground the total potential energy gained at the height of h is transformed/transferred to kinetic energy,since there is zero potential energy at ground level and PE=KE.


    For further reading on the theoretical aspects of explicit dynamic analysis with RADIOSS, I recommend you to go download and go through on our free ebook: Introduction to Explicit Analysis using RADIOSS