The Siemens Community Catalyst program was co-created with our community to acknowledge technology leaders who consistently contribute to the Siemens Community. Nominations are accepted on a rolling basis.
Hello ,
I want to plot impedance graph as a function of frequency for simple wire dipole antenna . I just have started using feko so I do not have idea how to get impedance graph.
Thank you
Hello @RG888,
I would suggest that you look at the Getting Started Guide and the Examples Guide for some help on learning about the basic mechanics of how to use FEKO. Specifically,
I hope that helps! /emoticons/default_smile.png' srcset='/emoticons/smile@2x.png 2x' title=':)' width='20' />
Andries
Hello andries,
Thank you for your suggestions. Yes example guide is good way .
Finally, I got the plot .
Thanks
Hello @RG888, I would suggest that you look at the Getting Started Guide and the Examples Guide for some help on learning about the basic mechanics of how to use FEKO. Specifically, 'Examples Guide A-1: Dipole example' will give you an example of a dipole 'Examples Guide A-7: Log Periodic antenna' will give you an example of how to plot impedance over frequency I hope that helps! /emoticons/default_smile.png' srcset='/emoticons/smile@2x.png 2x' title=':)' width='20' /> Andries
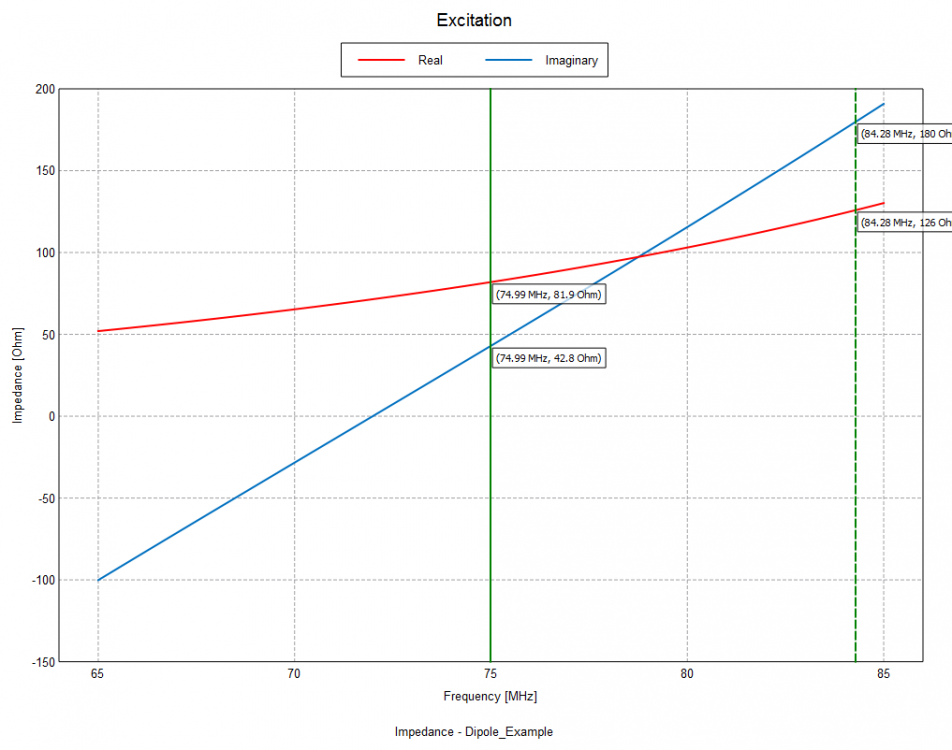
__Hello dear Altair Feko staff. In FEKO exhamples guide, you consider thin dipole (radius/length=1/1000), working at roughly 75 MHz frequency. It is well known, that 'such a dipole has a feedpoint impedance consisting of 73 Ω resistance and +43 Ω reactance' (from wiki). But in your exhamples guide i see
real part imag. part magnitude phase Impedance in Ohm 7.8729E+01 3.6658E+01 8.6845E+01 24.97
__So in manual Re(Z)=78.7 Ohm and this number differ's from theory. I improved mesh (from 'standard' to 'fine') and performed simulation. I expected Re(Z) to be closer to 73 Ohm. But i've got 81.9 Ohm (see picture below). Can you explain me why can't i approach 73 Ohm value.
__PS: I am still using old version of FEKO 7.0. May be this is the problem....
<?xml version="1.0" encoding="UTF-8"?>