Hypergraph

Altair Forum User
Altair Forum User
Altair Employee
edited November 2020 in Community Q&A

Hello Everyone


I have made a dogbone shape for tensile test analysis. Since the material is anisotropic, I used converse software to map the fiber orientation. As you can see in the model attached, on one side of the dogbone, there is a rigid, in which master node(1) is completely fixed and on the other side there is enforced displacement on the master node(2).

I want to create a graph where I obtain displacement of the master node(of the displaced side, 2) vs. reaction force of the other master node(fixed side, 1). I am doing a non linear quasi static analysis.

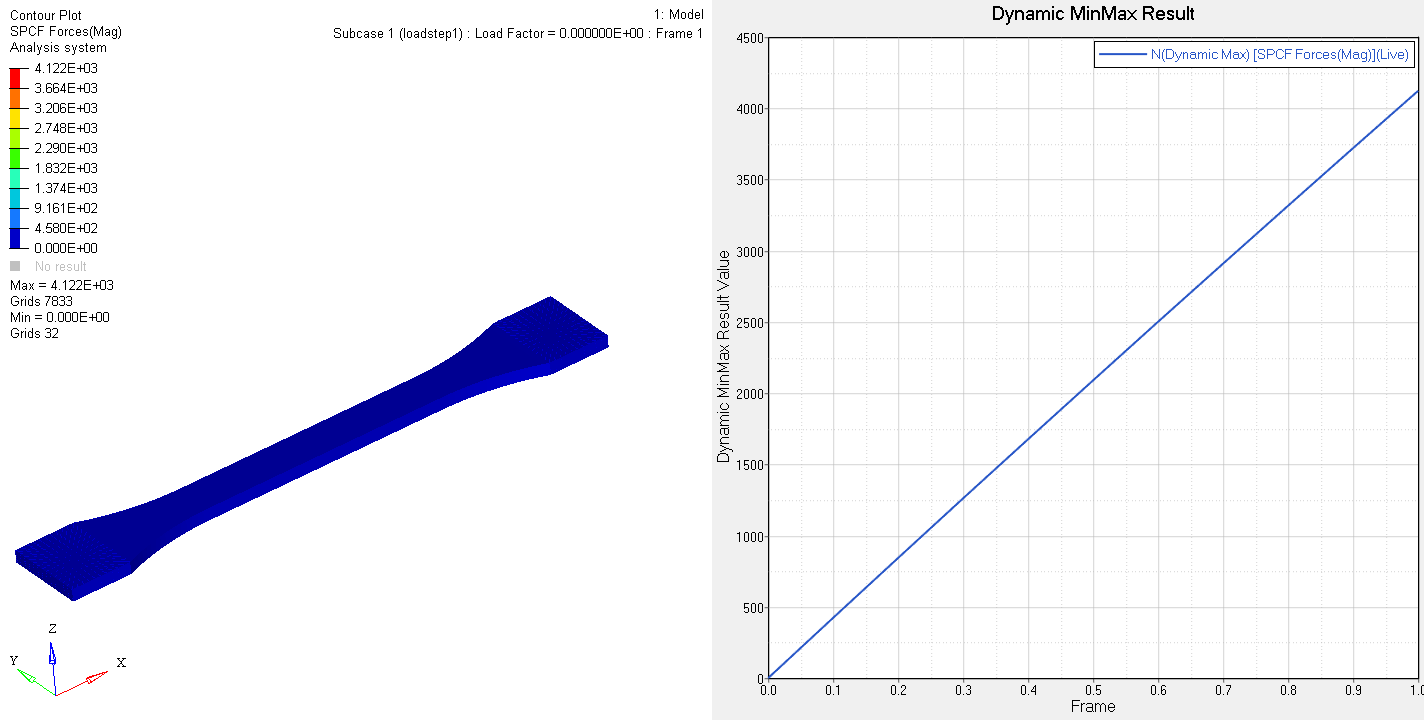
First, I tried to plot displacement vs time and that functions looks correct but reaction force vs time graph gives me just a point. I don't understand why it just shows a point and not a line like it does for 'displacement vs time' graph. I was planning to do cross plot once I obtain the reaction force vs time graph.

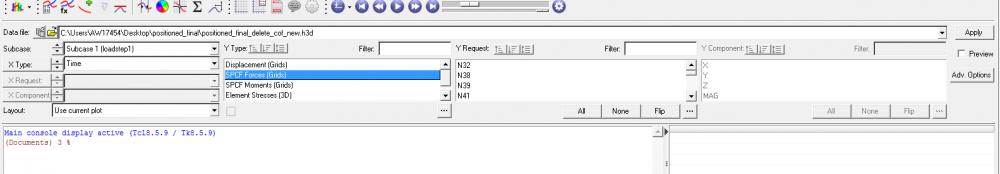
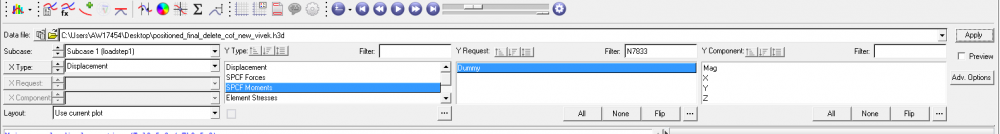
Some additional information: master node on the fixed side has id number: 7833 and master node on the displaced side is 7834

Would appreciate any help

Thanks in advance


Unable to find an attachment - read this blog

Answers

  • Altair Forum User
    Altair Forum User
    Altair Employee
    edited November 2020

    Hi Novak,


    Please run the attached file and let us know if this helps


    Thanks

    Vikas

    Unable to find an attachment - read this blog

  • Altair Forum User
    Altair Forum User
    Altair Employee
    edited March 2018

    Hi Vivek


    Thanks for the answer. However, it doesn't seem to work. Initially in my file, under Y-request I had the option to select the node ID (see attacehd screenshot 1). But now with your files, I don't see that option anymore. It just says 'dummy' under Y-request (see attached screenshot 2)


    Thanks


    <?xml version="1.0" encoding="UTF-8"?>screenshot1.PNG

    <?xml version="1.0" encoding="UTF-8"?>screenshot2.PNG

  • Altair Forum User
    Altair Forum User
    Altair Employee
    edited March 2018

    You should use HV to plot the results, by splitting the window into two.


    Please refer to the attached gif 

    <?xml version="1.0" encoding="UTF-8"?>video.gif

  • Altair Forum User
    Altair Forum User
    Altair Employee
    edited March 2018

    Hi Vivek


    It works great. Thanks a lot Vivek. Appreciate your help.

    Just couple more things.

    1.) What did you change exactly?

    2.) Why doesn't it work in hypergraph?


    Thanks

    Sincerely

    Jaivin

  • Altair Forum User
    Altair Forum User
    Altair Employee
    edited March 2018

    HI Jaivin,


    Incremental outputs of SPCF is not supported for small displacements, please add PARAM,LGDISP,1 to get incremental results of SPCF.


    I am able to get the curve in HG too, please use the latest version i.e. v2017.2


    Thanks

    Vikas

  • Altair Forum User
    Altair Forum User
    Altair Employee
    edited March 2018

    Hi Vikas


    Thanks again vikas. However, I am using hypergraph 2017.2 version but under Y-request, I only get an option of 'dummy'. I don't see how can I select the exact node ID which I want.


    Thanks

    Sincerely

    Jaivin