objective function curves

 Altair Employee
hi guys,
i want to see objective function curves, mass curves and volume curves in hyperview (after optimization), but i donot know, how to change the Parameters of Control Card in hyperworks.
thanks for your help!
Find more posts tagged with
Sort by:
1 - 1 of
11
Hi 9527kun
You can plot optimization design variable curves using <filename>.hgdata which will be written in your working directory.
This Hgdata file contains iteration history for objective function, design variables, response functions, etc..
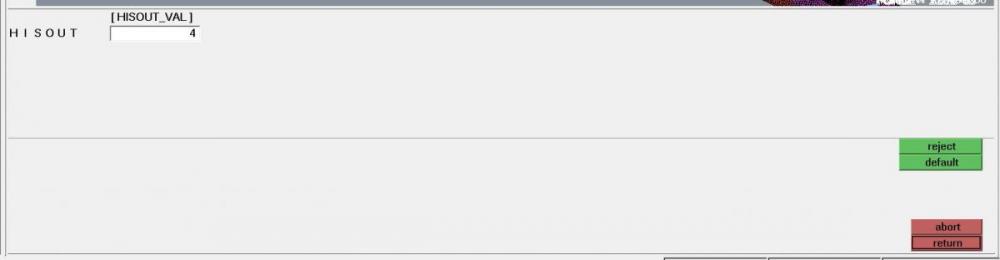
The content can be controlled using HISOUT.
for instance, if you want to output iteration history for non-stress responses (mass, volume, etc..), Goto control cards>> HISOUT and enter a value of 4 in [HISOUT_VAL]
Please refer to HISOUT in Altair OptiStruct > Reference Guide > Input Data > I/O Options Section:
<?xml version="1.0" encoding="UTF-8"?>