🎉Community Raffle - Win $25

An exclusive raffle opportunity for active members like you! Complete your profile, answer questions and get your first accepted badge to enter the raffle.
Join and Win

Function read error

User: "Altair Forum User"
Altair Employee
Updated by Altair Forum User

Hello,


I am Nikhil from Manipal University

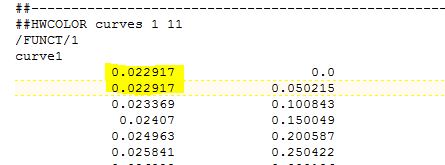
I am currently running few crash simulations on Aluminum honeycomb using the RADIOSS Block 120 format to determine the samples energy absorbing capabilities in different directions because it is an orthotropic material by nature. I am using the material law 28 for defining the behavior. I have inputted its density, the young's and shear modulus in every direction and stress vs volumetric strain graph obtained when the sample was compressed in 3 directions. The data points for the stress vs volumetric strain plots were inputted into the curve editor panel from the excel sheet directly. This was done to save time because there are around 5000 points defining the behavior in each direction. Hence, I just copy - pasted them. When I ran the simulation, I came across the error:
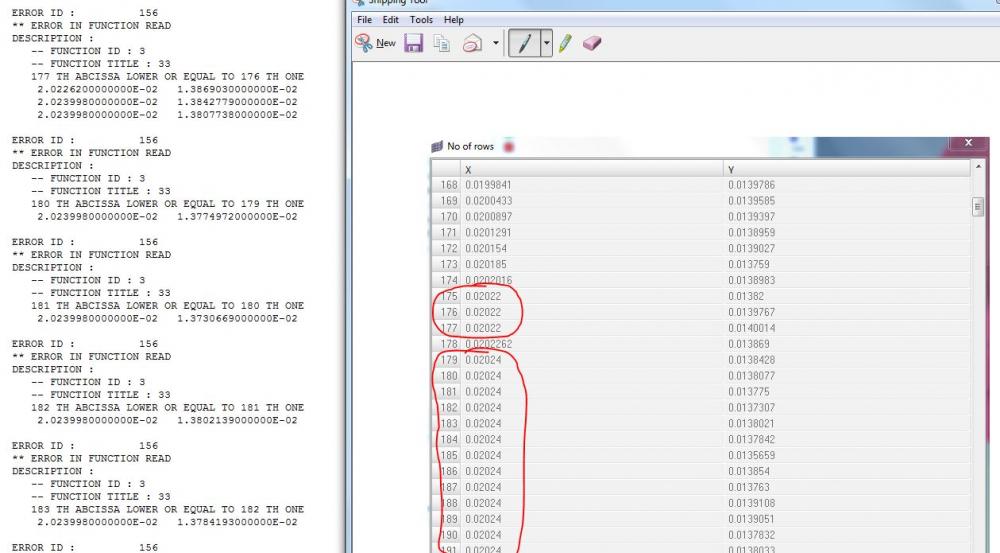
ERROR ID :       156

** ERROR IN FUNCTION READ

But when I inputted few random points (say 20) for each direction and ran the simulation, it went well without any errors.

Could you people please suggest me with a solution for the same and a way to input such huge number of points on the panel?

Thank you

Find more posts tagged with

Sort by:
1 - 9 of 91
    User: "Rahul Rajan_21763"
    New Altair Community Member
    Updated by Rahul Rajan_21763

    Hi,

    Could you share us .out file?


    Regards

    Rahul R

    User: "Rahul Rajan_21763"
    New Altair Community Member
    Updated by Rahul Rajan_21763

    Please make sure that in Function X & Y should not have identical digits.See attached screenshot.


    Regards

    Rahul R

    <?xml version="1.0" encoding="UTF-8"?>Error156.JPG

    User: "Altair Forum User"
    Altair Employee
    OP
    Updated by Altair Forum User

    Sir, 


    Please find the attached .out file and the 'hm' file for your reference.

    I am exactly not sure if such points exist within the generated data. There will be regions in the behavior where the points may be identical in either X or Y directions. If such problem exists, how can we possibly rectify the mistake without drastically changing the behavior

    Unable to find an attachment - read this blog

    User: "Rahul Rajan_21763"
    New Altair Community Member
    Updated by Rahul Rajan_21763

    Hi,

    I could see the identical rows in your /FUNCT/33 and the same is mentioned in out file.see attached screenshot.


    Regards

    Rahul R

    <?xml version="1.0" encoding="UTF-8"?>Erro-156.JPG

    User: "Altair Forum User"
    Altair Employee
    OP
    Updated by Altair Forum User

    Sir,


    I will correct this mistake and keep you updated. 

    I was curious enough to know if the parameters activated for defining the aluminum honeycomb material behavior were sufficient or not. They were young's modulus, shear modulus, yield stress functions in 3 directions and the Iflag parameter. 

    Please correct me if anything important is missing 

    User: "Altair Forum User"
    Altair Employee
    OP
    Updated by Altair Forum User

    hello sir,

    I am also having this same problem of curves. unknowingly i have assigned multiple y values to same x coordinate.

    How can I edit the curve points in radioss itself? as the no of points are many i don't want to import it again through excel file.

    thank you.,

    User: "Altair Forum User"
    Altair Employee
    OP
    Updated by Altair Forum User

    You can edit the values in curve editor (XY Plots- Curve editor)..

    User: "Altair Forum User"
    Altair Employee
    OP
    Updated by Altair Forum User

    How do i transfer Stress vs Strain points of graph from excel file to material definition OR curve in radioss?

    User: "Altair Forum User"
    Altair Employee
    OP
    Updated by Altair Forum User

    Use the Read Curves panel (in Post panel of HM) to read in an xy data set from an ASCII file. As a result, an xy curve is created that represents that data graphically.