A program to recognize and reward our most engaged community members
Hi everyone
I want to show thickness of 2D elems in HyperView ( Displacement Contour) as '2D traditional element representation' in HyperMesh
How to make it
Please help me about this
Maybe Altair's solvers have some special card allowing you to output thickness into H3D?
I use a script to write out a HWASCII file from Hypermesh/my FE solver in order to visualize the thickness in Hyperview.
Thank /profile/43398-qnguyen-dai/?do=hovercard' data-mentionid='43398' href='<___base_url___>/profile/43398-qnguyen-dai/' rel=''>@Q.Nguyen-Dai
I'll look for this scrip
Try this code:
*createmarkpanel elems 1 "Select Shell Elems"*createmark elems 2 'by config' 'quad4' 'tria3' 'quad8' 'tria6' *markintersection elems 1 elems 2 set eList [hm_getmark elems 1] hm_markclear elems 1 hm_markclear elems 2 set fh [open "thickness.hwascii" w] puts $fh "ALTAIR ASCII FILE"puts $fh "\$TITLE = Thickness"puts $fh "\$SUBCASE = 1 Subcase 1" puts $fh "\$BINDING = ELEMENT"puts $fh "\$COLUMN_INFO = ENTITY_ID"puts $fh "\$RESULT_TYPE = Thickness(s)" foreach eid $eList { set prop_id [hm_getvalue elements id=$eid dataname=propertyid] set thick [hm_getentityvalue props $prop_id \$PSHELL_T 0] puts $fh [format "%d %0.3E" $eid $thick] } close $fh;
If you have a lot of elements, maybe try FE output template.
HTH,
Thank somuch /profile/43398-qnguyen-dai/?do=hovercard' data-mentionid='43398' href='<___base_url___>/profile/43398-qnguyen-dai/' rel=''>@Q.Nguyen-Dai /emoticons/default_smile.png' srcset='/emoticons/smile@2x.png 2x' title=':)' width='20' />
If you just need to contour your thickness value of shells, you could also create a Result Math from your model (.fem or any other solver deck card).
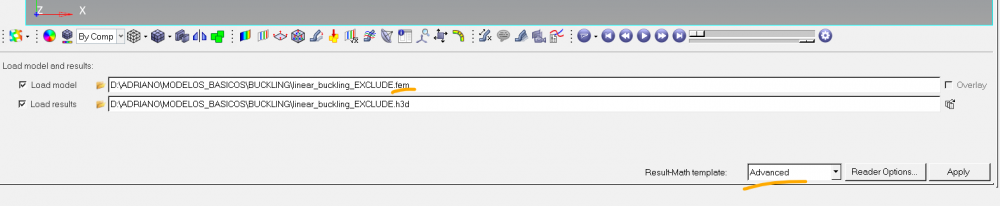
First step is to load your model as your solver deck, not the H3D file. And select Advanced Math Template.
<?xml version="1.0" encoding="UTF-8"?>
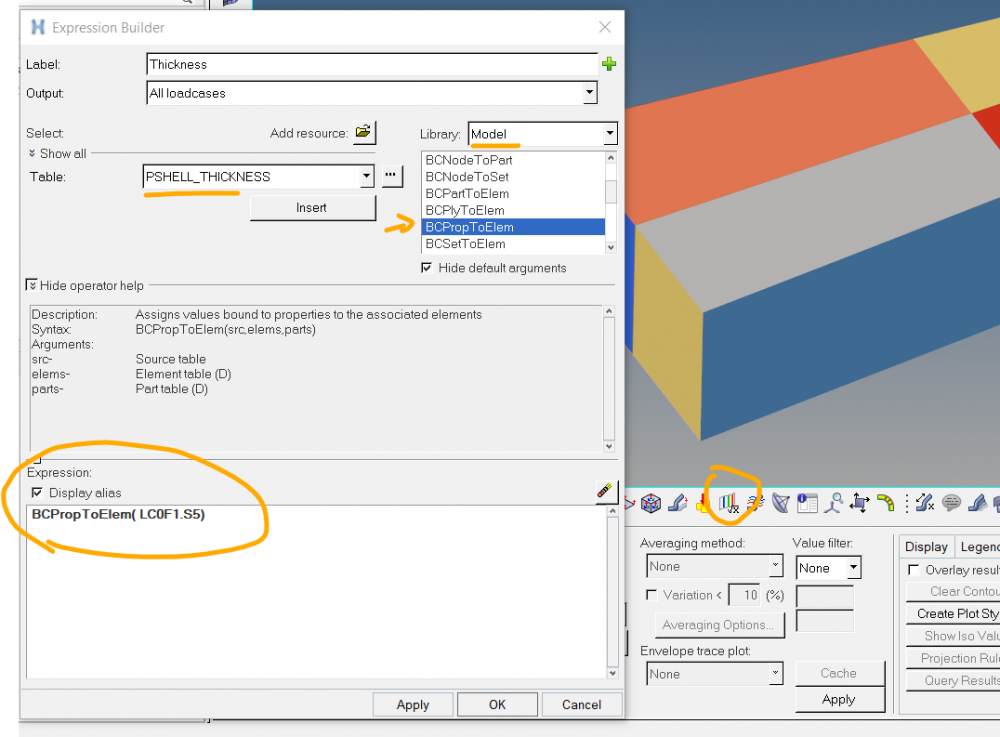
Then you create a new result using the 'Derived Results' function.
In your function you will map a Property value to your elements, using the command 'BCPropToElem', and giving it as argument the PSHELL_Thickness get from your model.
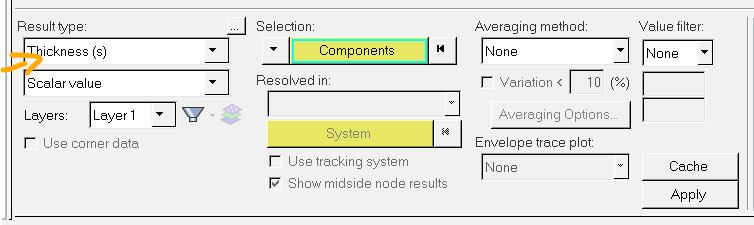
After that, a new contour will be available for you
If you just need to contour your thickness value of shells, you could also create a Result Math from your model (.fem or any other solver deck card). First step is to load your model as your solver deck, not the H3D file. And select Advanced Math Template. <?xml version="1.0" encoding="UTF-8"?> Then you create a new result using the 'Derived Results' function. In your function you will map a Property value to your elements, using the command 'BCPropToElem', and giving it as argument the PSHELL_Thickness get from your model. <?xml version="1.0" encoding="UTF-8"?> After that, a new contour will be available for you
Dear Adriano,
I have I used ".fem", ".h3d" and "advanced" settings but in the table browser there is no entry "P_SHEL_THICKNESS".
Do I have to check a specific output flag in Hypermesh?
Is there another explanation why I do not have this table?
Help is much appreciated.
Regards Sig
It need to be mentioned that this approach doesnt work when plotting any Derived Load Case. Also for any custom result legend is always continuous, so You need to be lucky to know your thk. intervals, and then add suited description in report how to interpret thickness interval e.g. from 3.0 to 3.5 - is it plot of thickness with tolerances of sheet 3.25+/-0.25 or its only for lowest sheet thickness 3.2 ?
But in my case thickness should change due to plasticity and i cannot get the correct plot of thickness in Expression Builder. Any idea how to get this from shell results?
Try this code: *createmarkpanel elems 1 "Select Shell Elems"*createmark elems 2 'by config' 'quad4' 'tria3' 'quad8' 'tria6' *markintersection elems 1 elems 2 set eList [hm_getmark elems 1] hm_markclear elems 1 hm_markclear elems 2 set fh [open "thickness.hwascii" w] puts $fh "ALTAIR ASCII FILE"puts $fh "\$TITLE = Thickness"puts $fh "\$SUBCASE = 1 Subcase 1" puts $fh "\$BINDING = ELEMENT"puts $fh "\$COLUMN_INFO = ENTITY_ID"puts $fh "\$RESULT_TYPE = Thickness(s)" foreach eid $eList { set prop_id [hm_getvalue elements id=$eid dataname=propertyid] set thick [hm_getentityvalue props $prop_id \$PSHELL_T 0] puts $fh [format "%d %0.3E" $eid $thick] } close $fh; If you have a lot of elements, maybe try FE output template. HTH,
hi, i am new for tcl
when i run in hypermsh,i select element ,and continue?
There are 2 points to consider in this thread:
Hope this helps further.
Thanks
Michele