maximum number of rows in curves column

 Altair Employee
hii all,
I have a problem regarding rows of curve section. I have nearly 7000 point cloud coordinates when I import it in curve section it only took first 2500 points. can somebody tell me how to increase those number of rows
<?xml version="1.0" encoding="UTF-8"?>
Find more posts tagged with
Sort by:
1 - 10 of
101
Altair EmployeeAltair EmployeeAltair EmployeeAltair EmployeeAltair EmployeeAltair EmployeeHi @rea2
You can use create curve option to import data from text editors.
Goto XYplots menu>>Create>> Curve and load the curve data
<?xml version="1.0" encoding="UTF-8"?>
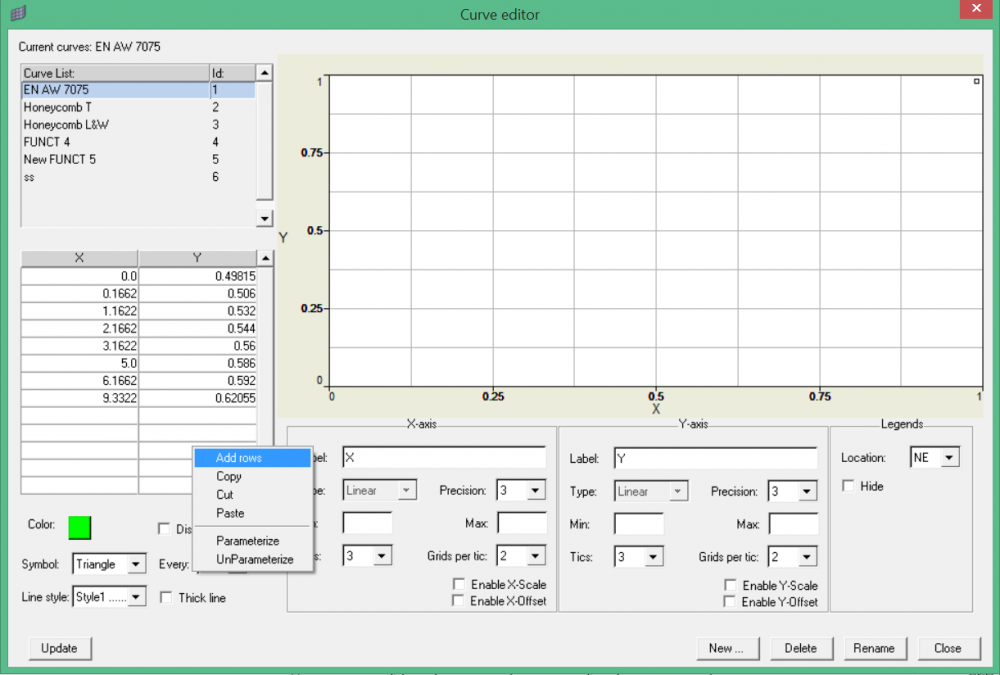
Hi Nikhil,
Normally the function may contain any number of points.
Can you try manually adding (copy-paste) these X-Y data after adding the rows?.
<?xml version="1.0" encoding="UTF-8"?>