🎉Community Raffle - Win $25

An exclusive raffle opportunity for active members like you! Complete your profile, answer questions and get your first accepted badge to enter the raffle.
Join and Win

Tutorial HS-4200 - tensile test

User: "Enrico_20294"
Altair Community Member
Updated by Enrico_20294

Hi, I`m writing my master thesis and I need an help with tutorial HS 4200.

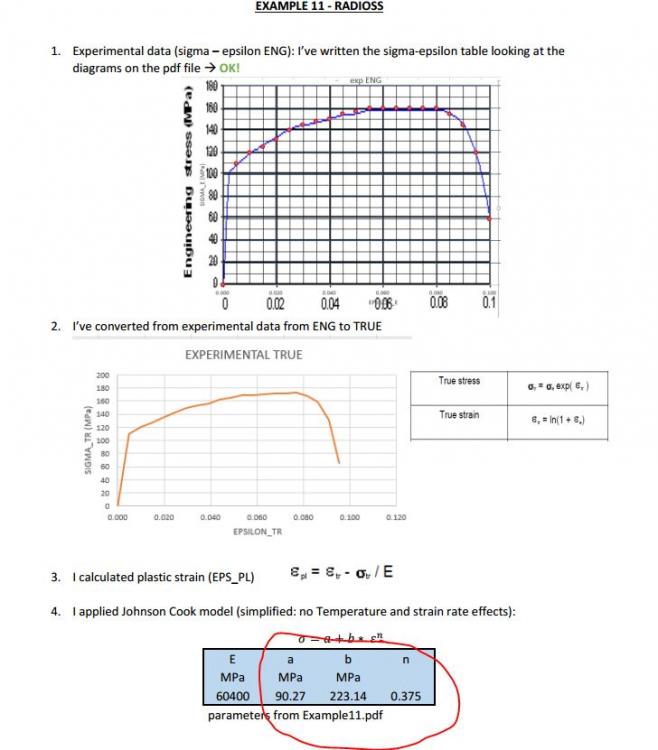
I`ve done all the tutorial and I`ve found the parameters shown in the pdf.

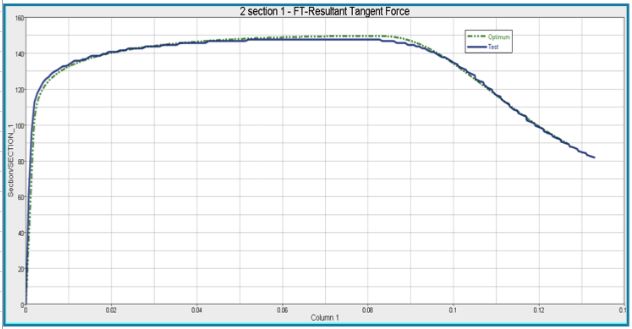
I`d like to print a comparison plot experimental data vs fitted curve, but I can`t do it.

I tried to recover strain and stress in hyperview, but they are different from the experimental stress/strain.


Please help me!

Find more posts tagged with

Sort by:
1 - 14 of 141
    User: "Rahul Rajan_21763"
    New Altair Community Member
    Updated by Rahul Rajan_21763

    Hypergraph you can use for plotting graph using build plot panel.

    Could you share some more information?

    User: "Enrico_20294"
    Altair Community Member
    OP
    Updated by Enrico_20294

    Hi Rahul, sorry I'm everywhere...

    This is my problem:

    I've done the HS 4200 tutorial (there's a pdf file and a video http://www.altairhyperworks.com/training/new_feature_videos/12/videos/system_identification/system_identification.htm), about the simulation of a tensile test.

    The objective is to find the material property values of Radioss Law2 card such that Radioss simulation of the tensile test gives the same curve as the test. Then we can be confident in our material model for further simuations.

    I've done every step of the tutorial and I've found the same values:

    E = 60400 MPa; a = 120 MPa; b = 135.5; 0.26286


    In the video, the comparison between the esperimental data and the simulation results is plotted (see the attachment) so I'd like to do the same.

    I try to plot the sigma-epsilon curve, using the Johnson-Cook formulation for the plastic zone:

    sigma = a + b * epsilon_PL ^n

    But the result is different from the experimental plot

    Then I tried recovering stress and displacement using Hyperview, but when I plot the results, they don't fit the experimental data.


    Thank you so much for your help

    <?xml version="1.0" encoding="UTF-8"?>Cattura.JPG

    User: "Enrico_20294"
    Altair Community Member
    OP
    Updated by Enrico_20294

    can anyone help me please?

    I`ve tried to better explain my problem, please find pdf file attached. Moreover, you can find excel files


    thank you so much

    Unable to find an attachment - read this blog

    User: "Rahul Rajan_21763"
    New Altair Community Member
    Updated by Rahul Rajan_21763

    We are working on your query.we will update you soon.

    User: "Enrico_20294"
    Altair Community Member
    OP
    Updated by Enrico_20294

    Thank you so much

    User: "Altair Forum User"
    Altair Employee
    Updated by Altair Forum User

    Hello Enrico,

    Can you tell the material values (a, b and n) you provided for this run?.

    Can you share the input file used for this run?

    User: "Enrico_20294"
    Altair Community Member
    OP
    Updated by Enrico_20294

    Hi George,

    input file (.rad) are TENSILE_TEST_0000.rad and TENSILE_TEST_0001.rad (attached), which I find in tutorials folder, in Hyperworks installation directory; no changes have been made in input files.

    As you can see in HS 4200 tutorial, the optimized parameters are:

    a = 119.99 MPa

    b = 135.48 MPa

    n = 0.26286

    I`ve found the same values, but unfortunately I can`t understand if they really fit experimental data.


    Thank you very much for your time and patience

    Enrico

    Unable to find an attachment - read this blog

    User: "Rahul Rajan_21763"
    New Altair Community Member
    Updated by Rahul Rajan_21763

    I see you have used other value for a,b&n.See attached screenshot from shared problem.pdf

    <?xml version="1.0" encoding="UTF-8"?>ABN values.JPG

    User: "Enrico_20294"
    Altair Community Member
    OP
    Updated by Enrico_20294

    You can find HS 4200 results in the following pages of pdf file.

    I tried to make a similar reasoning with Example 11 of Radioss tutorial, to understand if I was completely wrong.

    So, in the first pages of pdf file I reported results for Radioss Example 11, then the ones for HS 4200 tutorial.

    Materials parameters were different in radioss example and hyperstudy tutorial.


    Radioss Example11: I can plot the diagram reported in pdf, until necking point (using values reported in example11 pdf)


    Hyperstudy HS-4200: I can`t plot the diagram reported in the tutorial video, see my second post: June 2 (using optimal values reported at the end of tutorial)

    User: "Rahul Rajan_21763"
    New Altair Community Member
    Updated by Rahul Rajan_21763

    yes material parameter were different in Radioss example & Hst tutorial. I believe that  is reason for not getting same curve.You can give a try with those a,b & n values defined in HST 4200 tutorial.

    User: "Enrico_20294"
    Altair Community Member
    OP
    Updated by Enrico_20294

    Sorry, I have not explained

    At first, I tried to plot the diagram I`ve found in Radioss Example11.pdf, using Example11 parameters (they are reported on the pdf file). The diagrams I`ve obtained seem to be similar to the pdf one, until necking point.
     

    Then, I made HS-4200 tutorial and I found the parameters reported in HS-4200.pdf. So, I tried to plot the sigma-epsilon diagram, using those parameters and Johnson Cook law; but the diagram I plot doesn`t fit the experimetal data. I can`t understand where I`m wrong


    I apologize for the inconvenient I may have caused

    User: "Altair Forum User"
    Altair Employee
    Updated by Altair Forum User

    Enrico,

    Since you tried the same tutorial (HS 4200) with different material parameters (UTS changes to 223) the necking will not happen as you see in HS 4200 (where the UTS is 120). I think, this made the difference in your study.

    User: "Enrico_20294"
    Altair Community Member
    OP
    Updated by Enrico_20294

    I`ve done HS4200 tutorial with Hs4200 parameters, I didn`t changed the values

    User: "Enrico_20294"
    Altair Community Member
    OP
    Updated by Enrico_20294

    I think that there is an error in tutorial file.

    In step 4.24 it says that surface is 12.012, but  I think that it should be 6*1.7=10.2 mm^2

    I repeted hyperstudy simulation, I found new a,b,n parameters which seem to fit esperiment.xy curve


    Please check