Hello together,
is it possible to define and save a result (graph) in the output response window as a vector with all the given points instead of just evaluate one result for a specific point.
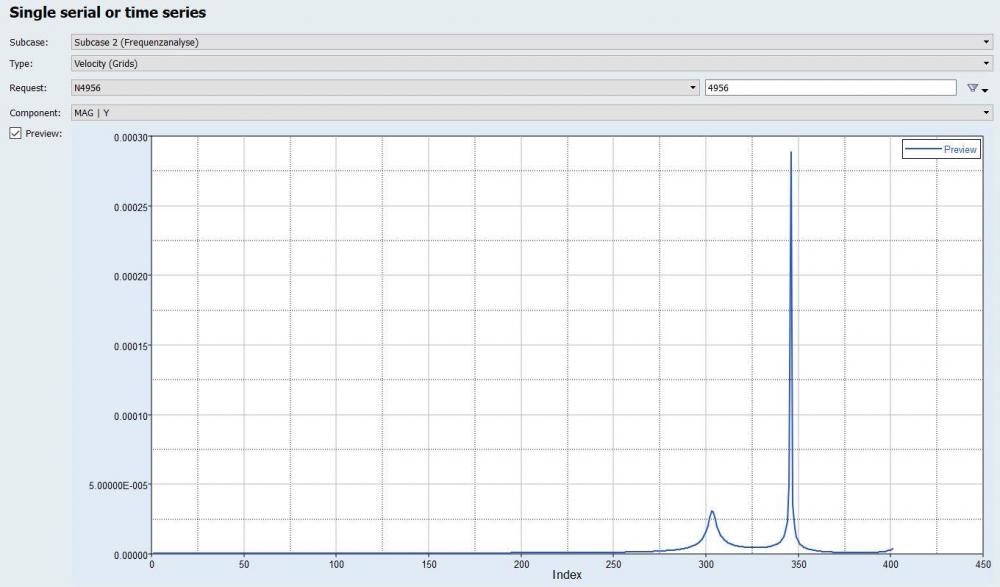
For example: I have the given curve as shown in the picture. Now i want to save this curve or graph as a vector or in a similar format. With the tutorials I can only read out one specific value of the curve at one given point. But my aspiration is it to save the whole curve, to display it or use it for a vectorial calculation.
Do you have any advise how i can do this with hyperstudy? Is it possible to do this in the define output response window?
Thanks in advance and cheers
<?xml version="1.0" encoding="UTF-8"?>