Plot displacement vs force
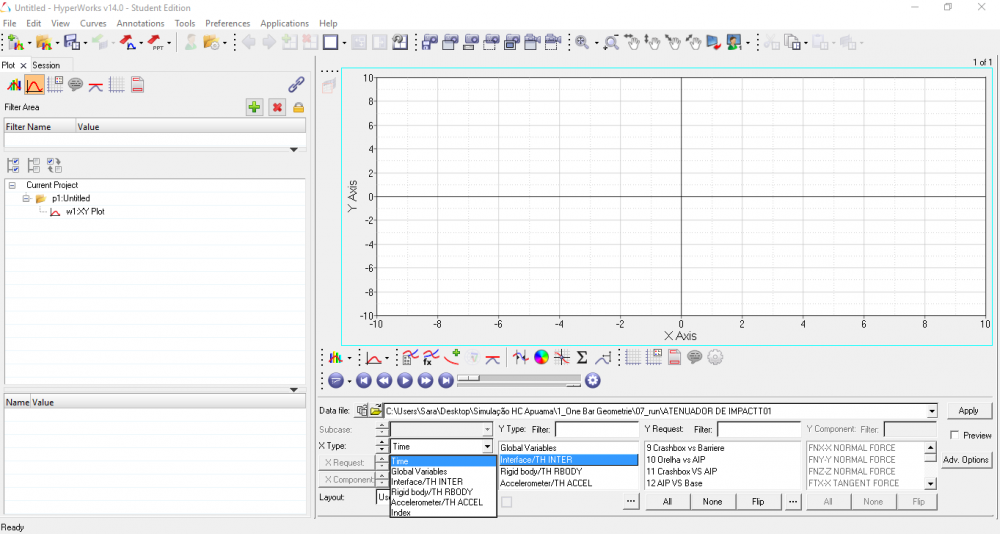
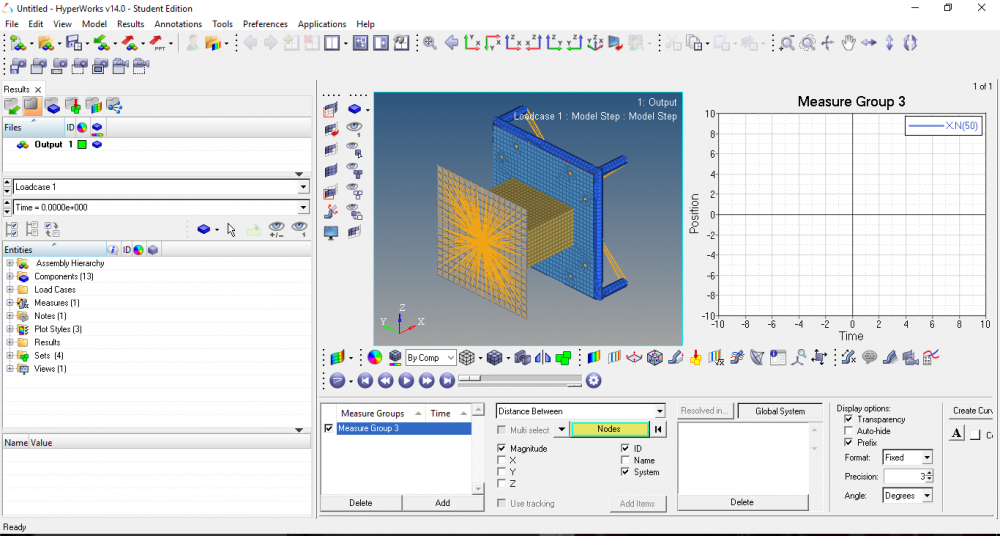
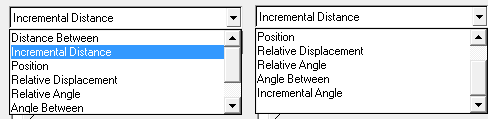
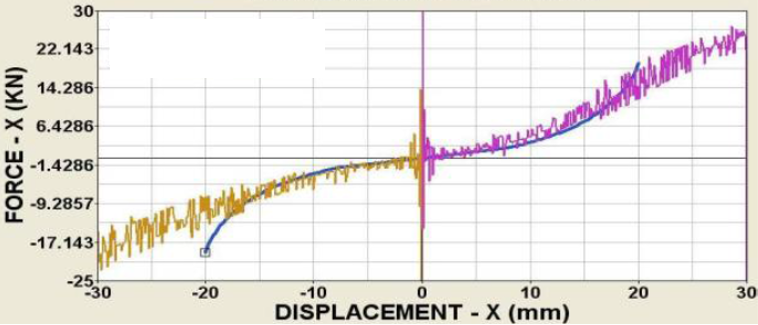
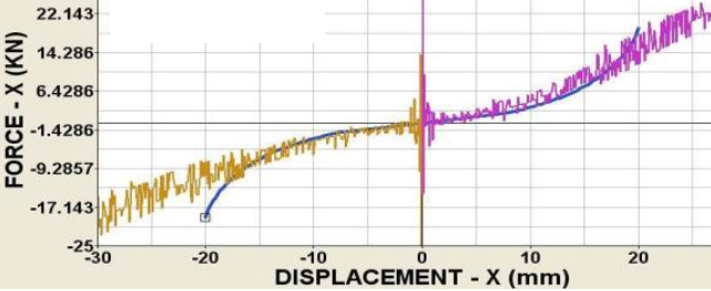
Hi, I'm developing our impact atenuator for an FSAE team based in the crashbox tutorial available by altair. The simulation gone all right but we are having some trouble to generate the graphics.In hypergraph I can't plot the displacement vs force graph, it's shown just a limited number of options in the X type. I want to know how can I generate the displacement vs force graph of the honeycomb or the graph of a point in it. Please, it's urgent.
Find more posts tagged with
-
Click the File → Load → Preference File.
-
Now the Preferences dialogue box will appear.
-
Select the Vehicle Safety Tools under the Registered Preferences.
-
Click on the “Load” button to get the MATH option in the Menu bar.
Hi,
In HyperGraph, go to File>Load>Preference File>Vehicle Safety Tools and you will get the Math option in the toolbars. From there you can select Two Curves>Crossplot.
In the file shared its only an example. Similarly choose the option for your case. You can try with Relative Displacement, select the node and select the axis .Now plot the curve which will give you displacement vs time plot.
Hi John,
I am attaching the file with rubber material john i want to apply the force in Positive & Negative Z direction But i know only positive. But i dont know about Negative, Please correct if i am wrong. I attached image shown below from this file i want to show output of this graph . Please help me to find this..
-->
Hi Ajay,
Please confirm whether you want to apply Force vs Displacement curve or Load vs Time or Displacement vs Time curve.If its Force vs Displacement, then you have to create a spring element. And since this is a pre tensioned condition use Type 32 property ( pretension spring property) and there you will get an option to provide Force vs Displacement curve. and you can provide these values in a single curve.
Yes John,
I am using Force vs time curve as a input which is in attached file. And i need to get the curve of Force Vs displacement as a output . I have attached the file as well please take a look once.
Here do i need to apply force in Positive & Negative direction as how is it possible in radioss. Please tell me.
Force Vs Displacement
Time Vs Force
Thanks john
I am not clearly understand i am attaching the file once please take a look and please give me the feedback.
Hi As per our conversation i have created the model with loading condition.i am not getting the curve i think there is some problem i think so. Please take a look once
Regards
Ajay
Hi Ajay,
With the existing curves in this model the component will behave in an 'equilibrium' state.
The force applied is also a very high value, thereby you are trying to ramp a big load in a very less time. This could cause element distortions.
Please create the curve as in the example mentioned in the last reply.
yes john its related to VIBRATION ANALYSIS OF AN ENGINE MOUNT. Please as below you can see the document.
Hi Ajay,
If you are trying for vibration analysis, you can perform the same n OptiStruct, where we can plot this transmissibility vs frequency curve.
We have a similar case study which can be accessed at http://www.altairatc.com/india/previous-events/2011/presenters/RL_07_Engine_mount_analysis_methodology_Piaggio.pdf
Hi Ajay,
Please go through these documents where you will get some relevant information.
http://insider.altairhyperworks.com/scripts-of-the-month-jan-2016/
(Plot displacement vs force)
Steps to be followed to Cross Plot any Two Curves by Using MATH option in HyperGraph 2D
What is plotting a graph?
A plot is a graphical technique for representing a data set, usually as a graph showing the relationship between two or more variables. The plot can be drawn by hand or by a computer. In the past, sometimes mechanical or electronic plotters were used.
What is meant by Cross Plotting?
Cross-plot is a synonym for scatter plots used primarily in the Earth Sciences and Social Sciences to describe a specialized chart that compares multiple measurements made at a single time or location along two or more axes. The axes of the plot are commonly linear, but may also be logarithmic.
Here we are going to cross plot, the Force vs Displacement in HyperGraph 2D
Step 1:
Import the .H3D file in HyperView, then Click on the “Build Plot” option as shown below:
Step 2:
Click the drop down list box, choose the Result type as “Displacement” , then select the Magnitude.
Step 3:
Now select the Node, at which the displacement has to be calculated along the direction of motion and click on the “Apply” button, to get the Displacement vs Time Graph.
By now the Window will be split into two part as HyperView and HyperGraph 2D which contains the Graph as shown below:
Step 4:
After getting the Displacement vs Time graph, switch your Hyperview window into HyperGraph 2D by clicking the
icon, in order to plot the Total Resultant Force vs Time graph.
Step 5:
In order to get the Total resultant force graph, select the X Type as Time and Y Type as Interface (ref img 1), which is created between the Impactor and Car, then click “Apply” button as shown below (ref img 2):
Img 1
Img 2
Step 6:
After getting the graph, click on the MATH option available in the Menu bar in order to Cross Plot the Total Resultant Force vs Time and Displacement vs Time Graph.
If MATH option is not available in the Menu bar, do the following procedures to get the MATH option:
Step 7:
By clicking on the MATH option, we will get the window layout as shown below. In order to select the Curve X, we have to press Shift +Left Mouse Click on the Displacement curve. For the Curve Y, we have to press Shift +Left Mouse Click on the Total Resultant Force curve (ref img 3)
Total Resultant Force Curve (Y) Displacement Curve (X)
After clicking on the curve, we will get the corresponding value of the Graph, as shown below:
Img 3
Step 8:
After selecting the curves in the Parameters, Click on the Create new pages with One curve per plot option under Layout and click on the “Apply” button.
Step 9:
Finally we will get the Force vs Displacement graph as shown below:
Step 10: To rename the X axis and Y axis
Move the cursor on the X axis, it will turn to Orange colour. Click on it and rename it as Displacement and click on Y axis, rename it as Force.
After renaming both the X axis as Displacement and Y axis as Force, Click on the “Apply” button to get the Force vs Displacement graph by Cross Plotting.
Hi,
Its possible to create displacement vs force plot in HyperGraph using the cross plot option.
Please go through the attached files which shows the steps to create it.
Unable to find an attachment - read this blog