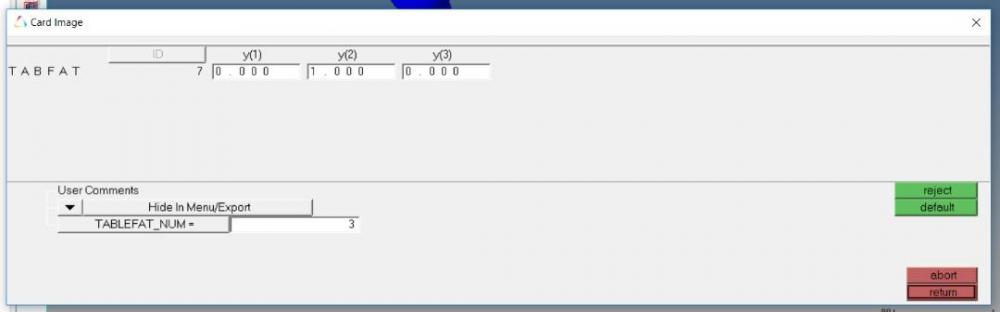
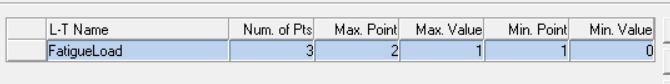
Hey guys, I’m a mechanical engineer student and I participate in a project where I analysis the structure of a modern tricycle. I need help with the fatigue analysis. I make the training of fatigue by Altair and tried make the analysis, but I’m not sure of the results. I think the problem it’s on the TABFAT.
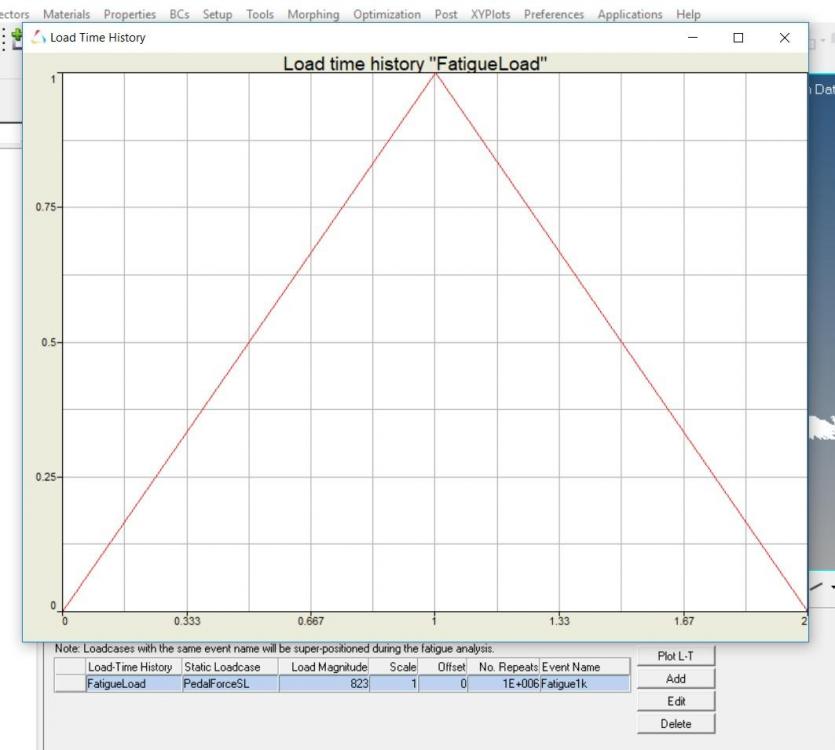
About the TABFAT:
My analysis has 1D and 2D elements. I obtained the following values in the Linear Static Analysis:
| | Analysis 1D | Analysis 2D |
| σ_max | 24,59 MPa | 267,9 Mpa |
| σ_min | -19,71 MPa | 0 MPa |
Can I represent the load cycle of my “vehicle” like a sinusoidal curve? Can you show me how I represent it?
Should I represent these values for each of the fatigue analysis like one analysis for 1D elements and other analysis for 2D elements? Can I “mix” these values for the two analyses representing σ_max = 24,59 MPa and σ_min = -19,71 MPa?
I think that a correct method is consider my load cycle like a variable load, but I don’t obtain experimental data.
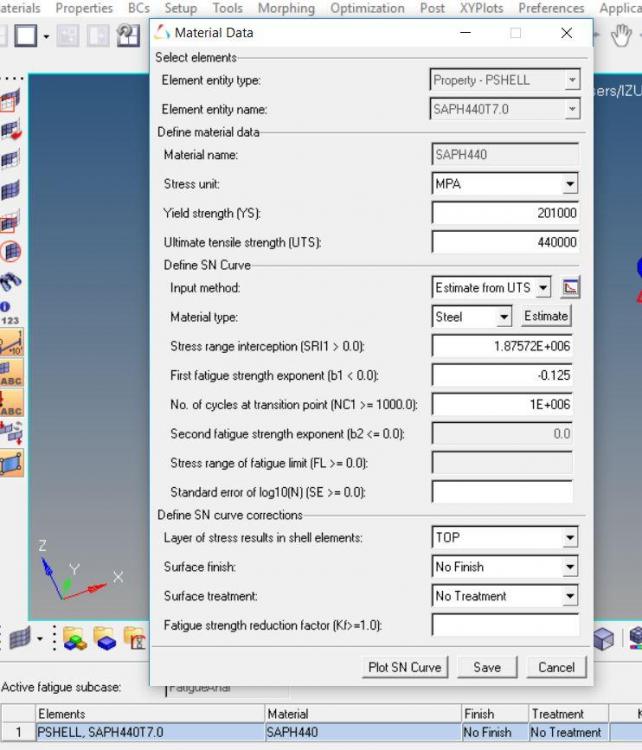
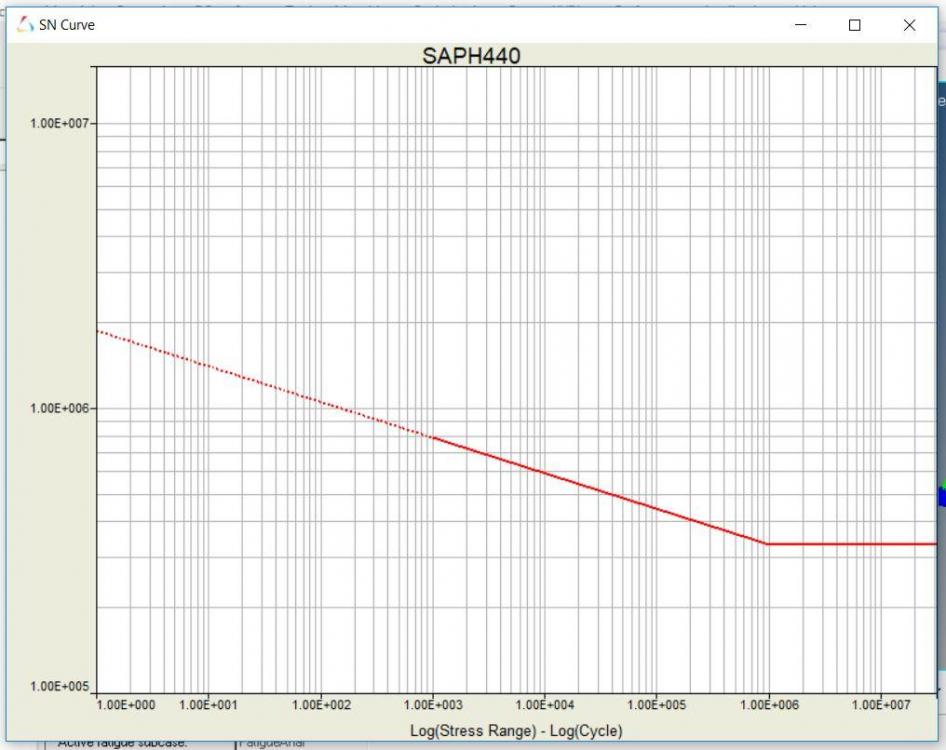
About the MATFAT:
I acquired the MATFAT data by the eFatigue website, but I don’t obtain the SE (standard error of log(N)). How I find out this? If I consider SE like “Default” (zero), how will affect my analysis?
Note: I’m making a SN analysis.
Thanks for helping!