The Siemens Community Catalyst program was co-created with our community to acknowledge technology leaders who consistently contribute to the Siemens Community. Nominations are accepted on a rolling basis.
Hi,
I have done analysis by stopping and restarting a radioss run. so now i have two tfile, how to plot graph combining the tfiles? then only i can get graph for the complete analysis.
thanks in advance.
Hi Guru,
Choose the first time history file, that is T01 and plot. This will contain the whole time history data for the complete run.
Hi Guru, Choose the first time history file, that is T01 and plot. This will contain the whole time history data for the complete run.
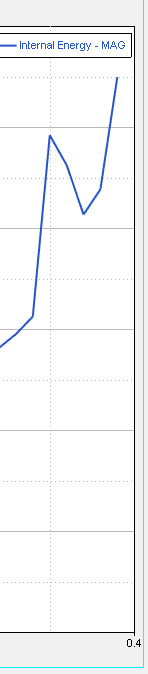
i tried it but im not getting it. i ran simulation for 0.4 secs, but in graph last few millisecs are not there, its there in restarted analysis tfile i guess. and i have two tfiles T01,T02 (T02 was generated after i restarted the run)
<?xml version="1.0" encoding="UTF-8"?>
How much was the run time for the first run, that is in _0001.rad?.
Also, please upload T02 file, plot and review the curve.