Hello Altair users and forum members,
Fist of all I take this opportunity to introduce myself in this forum. I´m relatively newbe with this tool and this forum is very usefull to solve many doubts which appeared.
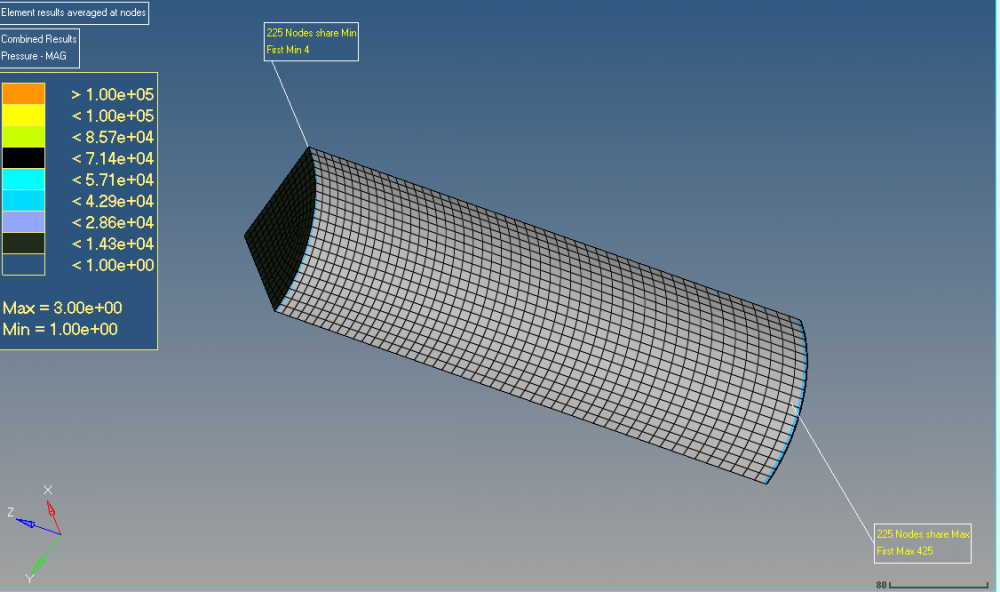
I have a question related with contour load maps and legend attached. The problem is i´d like to represent loads a pressure as a contour color map and I got it, but legend is not customizable (at least such of i want). legend represents values with smaller than symbols and I want represent with exact values (equal to), is possible.
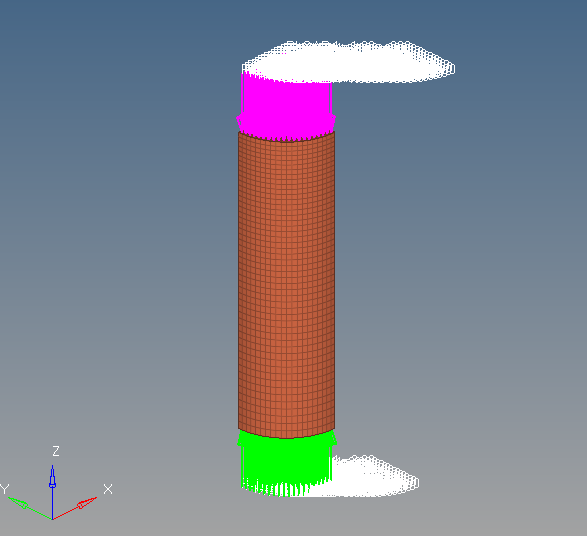
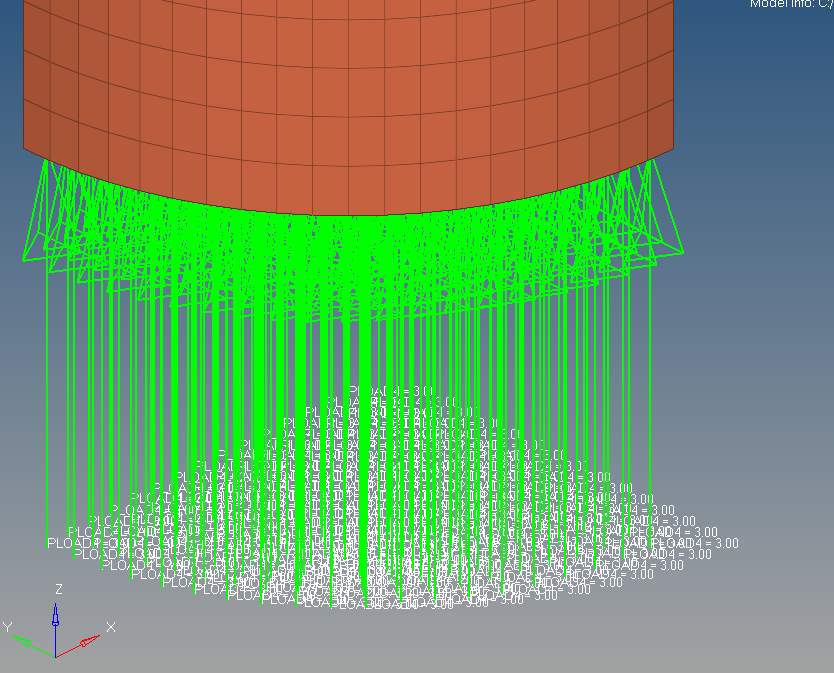
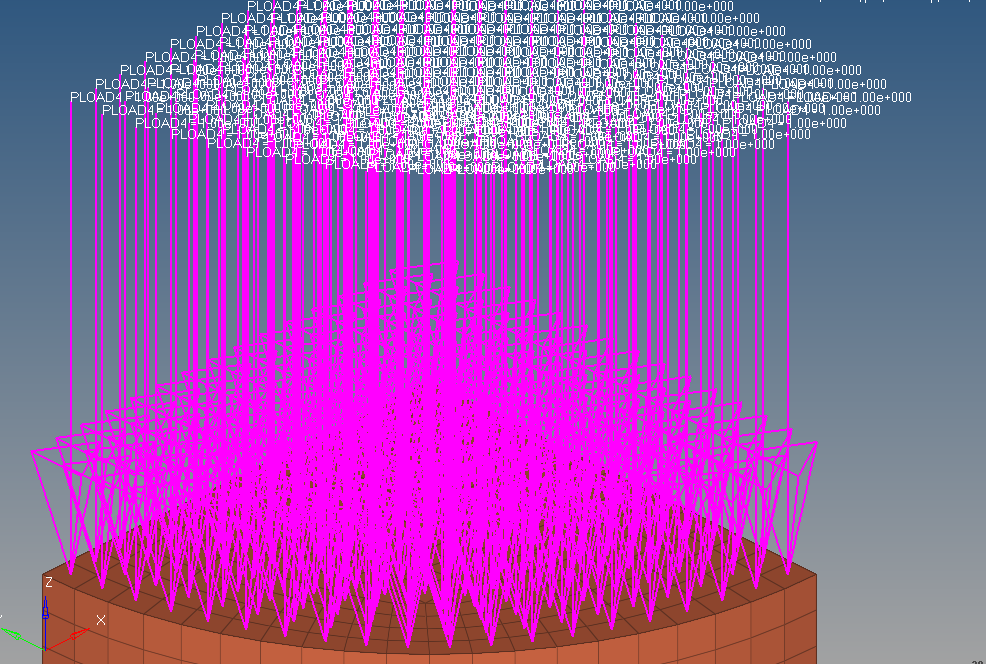
In the simple example attached, in opposite faces of a quarter cylinder I´ve been imposed 1MPa in one face (upper face) and 3MPa in opposite one. The question is simple, is possible generate a contour map with a color assigned for 1Mpa and other one for 3MPa?. I don´t know the way of control legend.
Thanks in advance
<?xml version="1.0" encoding="UTF-8"?>
<?xml version="1.0" encoding="UTF-8"?>
<?xml version="1.0" encoding="UTF-8"?>
<?xml version="1.0" encoding="UTF-8"?>
Unable to find an attachment - read this blog