Hello @ all,
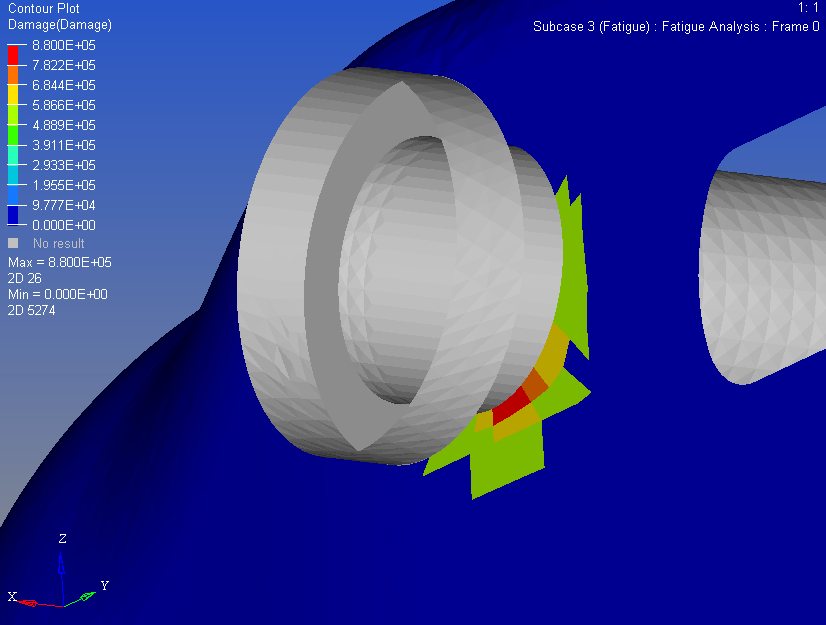
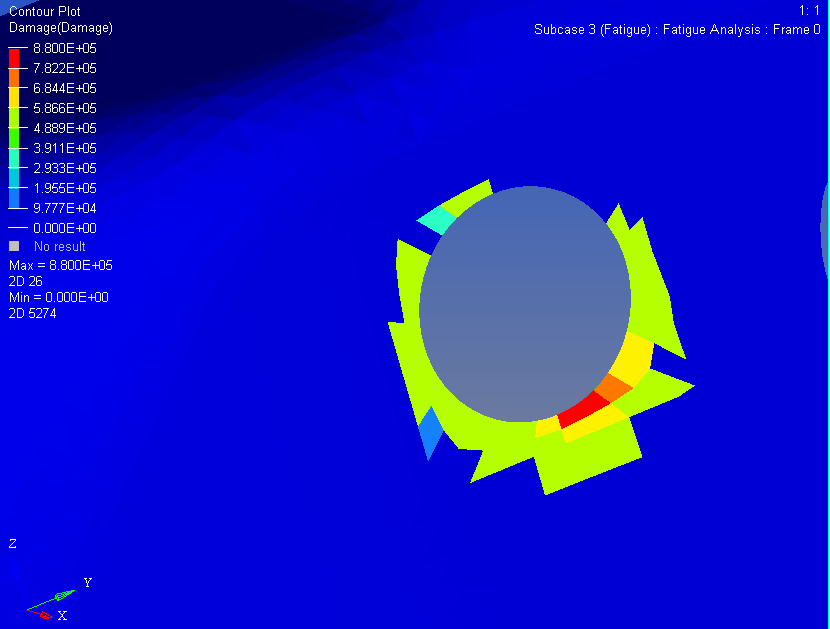
I did a Fatigue SN analysis using Optistruct and got the Results which look quite realistic. The only problem i have ist that i don't really get the conclusion of the Contour Plot Damage Legend.
I think the Scale describes the number of steps until an Element breaks down, please correct me if i got this wrong. Normally a crack starts from an Edge of a geometry, but as the Legend in combination with the model results tell me the elements which are colored yellow break down before the red ones do. This seems quite unrealistic to me because the load translation starts at the edge elements. It would be nice if someone could explain that to me, did i understand the legend wrong or maybe the model has some issues.
Greetings
![]()
![]()
![]() Christian
Christian
<?xml version="1.0" encoding="UTF-8"?>
<?xml version="1.0" encoding="UTF-8"?>