The Siemens Community Catalyst program was co-created with our community to acknowledge technology leaders who consistently contribute to the Siemens Community. Nominations are accepted on a rolling basis.
hello i have done frequency response analysis
with the help of
RD2010-modal frequency response analysis of a flat plate
i have added HGFREQ
but i am not able to get graphs
Hi,
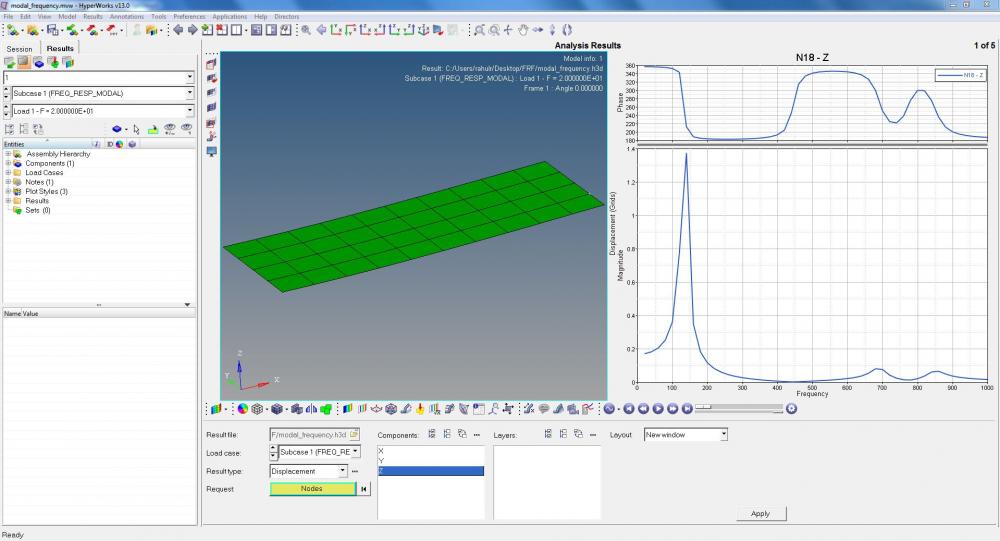
just check whether you have results file and mvw file available in your folder or not?
You can plot graph from HV aswell. See attached screenshot.
Regards
Rahul R
<?xml version="1.0" encoding="UTF-8"?>