Decay of Pretension due to Transverse Excitation

Altair Forum User
Altair Forum User
Altair Employee
edited October 2020 in Community Q&A

Hello All,


I'm PG student working for my thesis. I am trying to study the self-loosening behavior of bolted assembly under the effect of transverse excitation. 

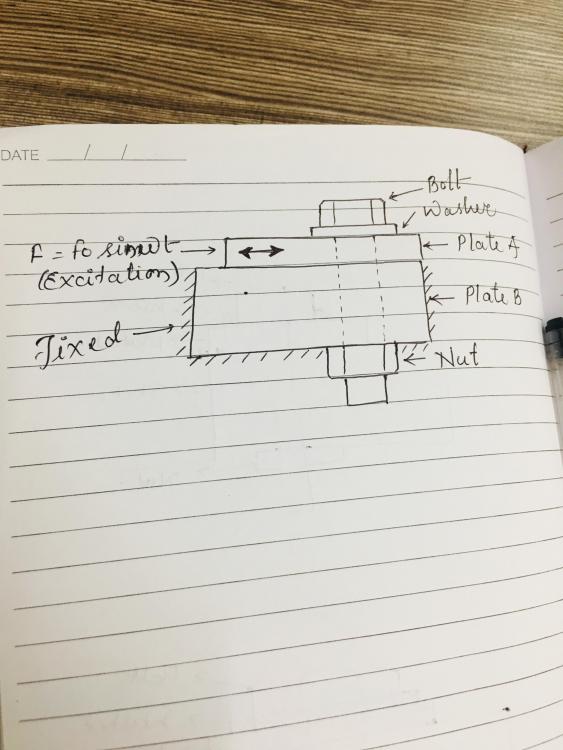
Kindly refer the attached image for reference. looking for guidance for the same as earliest.


We have given frictional contact at each contact interface & pretension is applied. BC's applied are 'Direct transient (Force Excitation)'. The self loosening phenomenon can be understood by monitoring the 'Pretension vs time graph' 


1. How to generate request for 'Pretension vs time graph' ?

2. There are few errors are coming across for transient output request. Is there any sample deck for it ?


 <?xml version="1.0" encoding="UTF-8"?>IMG-9878.thumb.jpg.9b6a996afa69f37b14b160acbe32151d.jpg
Answers

  • Rahul Rajan_21763
    Rahul Rajan_21763 New Altair Community Member
    edited April 2019

    You can refer to the below video for bolt pretension using OptiStruct.

    e213a34d01fdcf930ce634ed42e335cb00484d2a

    OptiStruct Nonlinear Learning Center

    Unable to find an attachment - read this blog

  • SuyashS
    SuyashS Altair Community Member
    edited May 2020

    Hello All,


    I'm PG student working for my thesis. I am trying to study the self-loosening behavior of bolted assembly under the effect of transverse excitation. 

    Kindly refer the attached image for reference. looking for guidance for the same as earliest.


    We have given frictional contact at each contact interface & pretension is applied. BC's applied are 'Direct transient (Force Excitation)'. The self loosening phenomenon can be understood by monitoring the 'Pretension vs time graph' 


    1. How to generate request for 'Pretension vs time graph' ?

    2. There are few errors are coming across for transient output request. Is there any sample deck for it ?


     <?xml version="1.0" encoding="UTF-8"?>IMG-9878.thumb.jpg.9b6a996afa69f37b14b160acbe32151d.jpg

    Hi, 

    Were you able to get this to work? 

    You can  plot pre-tension vs time by selecting PRETBOLT under the GLOBAL OUTPUT REQUEST. Select OPTI as the format under PRETBOLT and make sure that the OPTI is added as a format in the FORMAT control card.


    Hope this helps.


    Suyash