Dear All,
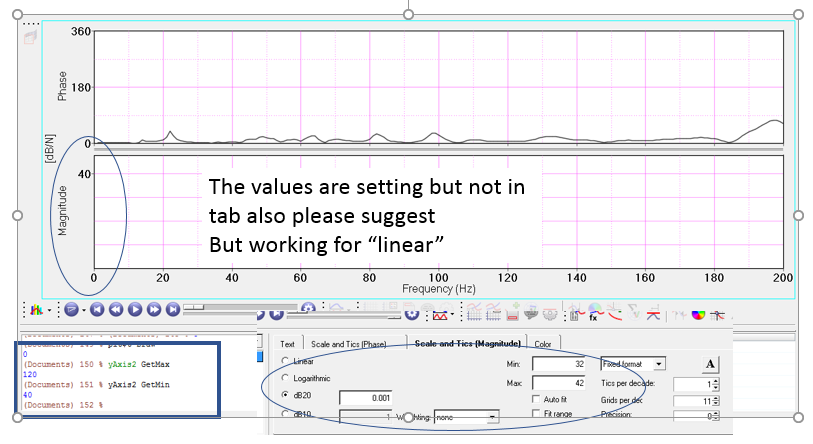
I,am Struggling to set the Axis in complex plot for dB20 refer, but linear the axis are set proper.
In dB20 the values are set but not visible.
Please find the below code what i did wrong i cant get it.
set y [hwi ListAllHandles]
foreach i $y {
puts $i
$i ReleaseHandle
}
set PCHFilePath 'E:\\STUDY\\HyperGraph\\2SV_MP_CAE1_NV_TMB_VTF_LT_Header.pch'
set t [clock seconds];
hwi GetSessionHandle se$t;
se$t GetProjectHandle proj$t;
proj$t GetPageHandle page$t [proj$t GetActivePage];
page$t GetWindowHandle win$t [page$t GetActiveWindow];
win$t GetClientHandle plt$t;
plt$t GetCurveHandle myCur$t 1
plt$t SetChartType 'complex'
se$t GetDataFileHandle dataFileHandle$t $PCHFilePath;
set dataFileName [dataFileHandle$t GetFilename]
set typeList [dataFileHandle$t GetDataTypeList]
set subCaseList [dataFileHandle$t GetSubcaseList]
set subCaseName [lindex $subCaseList 0]
set nsub [llength $typeList];
set xType [lindex $typeList 0];
set yType [lindex $typeList 2];
#page$t SetLayout 1
set nofw [page$t GetNumberOfWindows]
plt$t Draw
set complexTopArea [plt GetComplexTopArea]
set complexMode [plt GetComplexMode]
plt SetGridLineColor 44
plt SetComplexMode pm
set complexMode [plt GetComplexMode]
# plt$t GetHeaderHandle header$t;
# header$t SetVisibility true;
plt$t SetComplexTopAreaProportion 50
plt$t AddCurve;
set ncurve [plt GetNumberOfCurves];
puts 'No of Curevs at wind ---> $ncurve '
plt$t GetCurveHandle myCur$t $ncurve;
myCur$t SetVisibility true;
myCur$t SetLineColor 150
myCur$t SetDisplayInLegend false
plt$t GetHorizontalAxisHandle xAxis 1;
xAxis SetVisibility true;
#xAxis$t SetAutoFit true;
xAxis SetScale 'linear';
xAxis SetMin 0;
xAxis SetMax 200;
#xAxis$t SetTicsFont
set xLabel 'Frequency (Hz)';
xAxis SetLabel $xLabel;
xAxis GetTicsFontHandle iFont
set sizeOfTic [iFont GetSize]
puts 'sizeOfTic: $sizeOfTic'
iFont SetSize 12
iFont SetWeight bold
iFont ReleaseHandle
plt$t GetVerticalAxisHandle yAxis 1;
yAxis SetVisibility true;
#yAxis$t SetAutoFit true;
yAxis SetScale 'linear';
yAxis GetTicsFontHandle iFont
iFont SetSize 12
iFont SetWeight bold
iFont ReleaseHandle
yAxis SetMin 0;
yAxis SetMax 360;
#yAxis$t SetFitToRange true
yAxis SetNumberOfTics 3
yAxis SetLabel '\[dB/N\]';
plt$t GetVerticalAxisHandle yAxis2 2;
yAxis2 SetVisibility true;
yAxis2 SetAutoFit false;
yAxis2 SetScale 'dB';
#yAxis2$t SetScaleFactor 0.0001;
#yAxis2$t SetMin 40
set dataaa [yAxis2 GetdB20Reference]
yAxis2 SetdB20Reference 0.001
yAxis2 SetMin 40;
yAxis2 SetMax 120;
yAxis2 SetNumberOfTics 0
yAxis2 SetNumericFormat 'Fixed'
yAxis2 SetNumericPrecision 0
yAxis2 SetFitToRange true
yAxis2 GetTicsFontHandle iFont
iFont SetSize 12
iFont SetWeight bold
iFont ReleaseHandle
myCur$t GetVectorHandle vectorX x;
vectorX SetType 'file';
vectorX SetFilename $PCHFilePath;
vectorX SetDataType $xType;
#vectorX$t GetRequest;
vectorX SetSubcase 'Subcase 1';
set vectYZ [myCur$t GetVectorHandle vectorY 'yp'];
vectorY SetType 'file';
vectorY SetFilename $PCHFilePath
vectorY SetDataType 'Accelerations';
vectorY SetSubcase 'Subcase 1';
vectorY SetRequest 'Point id 61023858';
vectorY SetComponent 'X-Trans';
vectorY SetScaleFactor 1;
set vectY [myCur$t GetVectorHandle vectorY2 'ym'];
vectorY2 SetType 'file';
vectorY2 SetFilename $PCHFilePath
vectorY2 SetDataType 'Accelerations';
vectorY2 SetSubcase 'Subcase 1';
vectorY2 SetRequest 'Point id 61023858';
vectorY2 SetComponent 'X-Trans';
myCur$t SetVisibility true;
myCur$t SetLineColor 150
myCur$t SetDisplayInLegend false
plt$t Recalculate;
plt$t Draw
<?xml version="1.0" encoding="UTF-8"?>