The Siemens Community Catalyst program was co-created with our community to acknowledge technology leaders who consistently contribute to the Siemens Community. Nominations are accepted on a rolling basis.
My Ackermann % vs. steering-wheel angle plot in HyperGraph shows up blank. Is there a specific way to generate this plot? Do I need to add the Ackermann equation as an output expression to see the results?
Hi @premkumar_07,
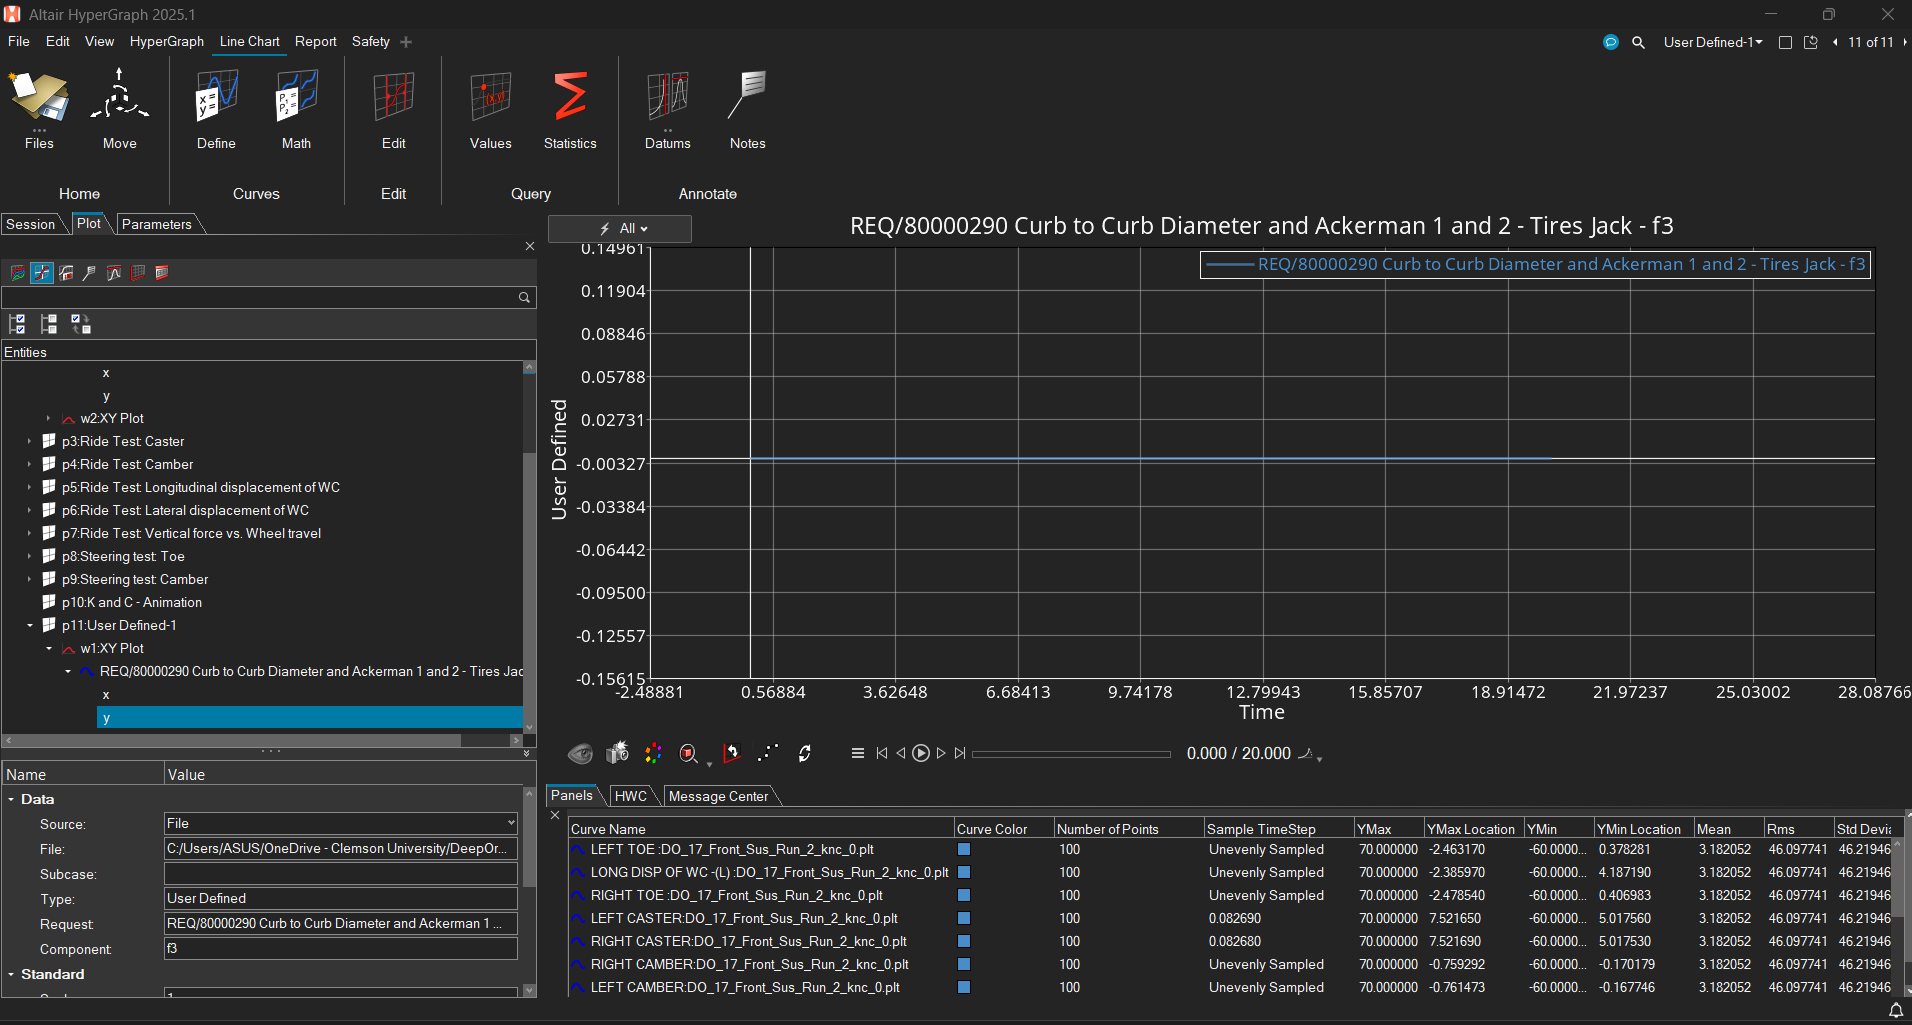
I unfortunately realized I had completed my simulation and plot using version 2025.0 and not 2025.1.
When attempting to plot the Ackerman % in 2025.1, I see the same error you are displaying.
I will submit a ticket to Development, and in the meantime I suggest that you use 2025.0.
Is that version available to you?
Hope this helps!
Adam Reid
Can you share how you are trying to create this custom plot? There may simply be an issue in how you have defined the curves. Can you please click on Define in the ribbon and display how you are trying to make this custom plot?
Hello Adam,
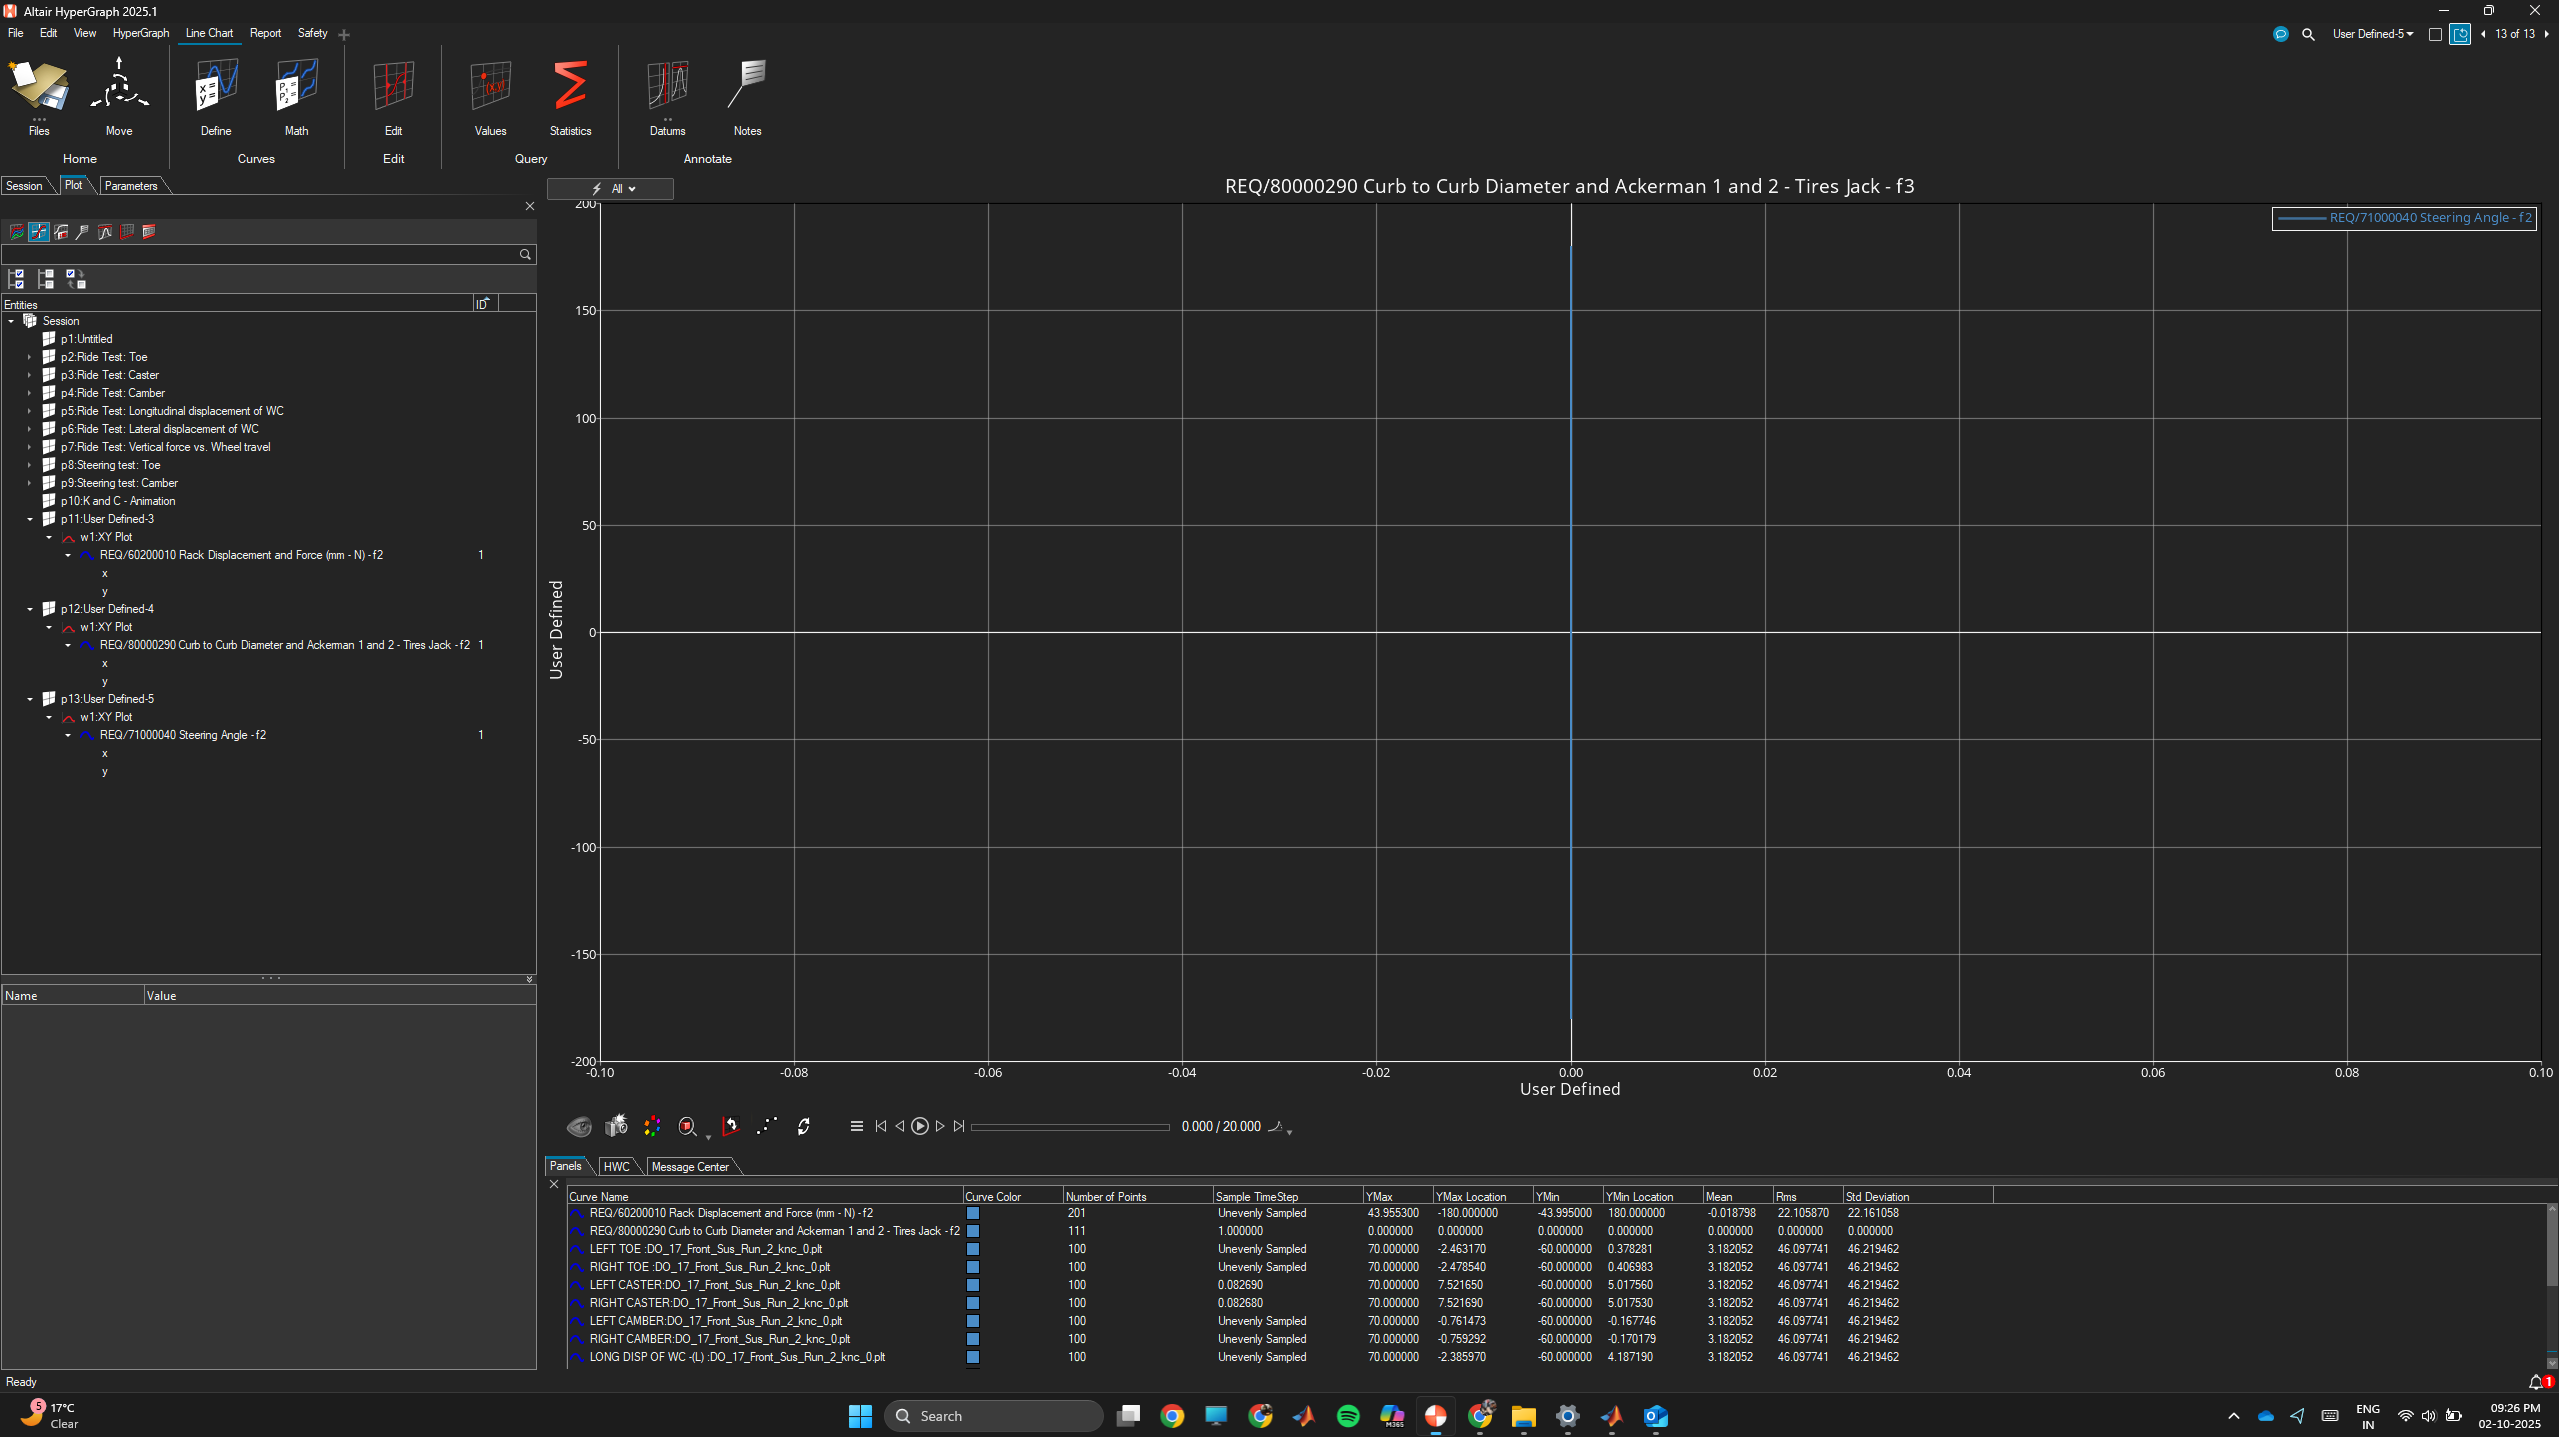
Thanks for getting back. I have attached the screen recording of how I am generating the plots. Thank you
The Percent Ackerman (Method 1), Ackerman Deviation (Method 1), Percent Ackerman (Method 2), and Ackerman Deviation (Method 2) are F3, F4, F7, and F8 respectively. Please use F3 instead of F2, as that is the Curb to Curb Diameter (Method 1).
Please see the following link for REQ/80000290
Hello Adam, I tried selecting F3, F4, F7 and F8; the results remain the same. Thanks
hello Adam, It's still the same.
Hi Adam, The issue has been solved. Thank you for the help