For Part 1, see here:
What Have We Learned: The Nonlinear Static analyses, an inherently more accurate analysis type than the P-Delta types, predicts that buckling will occur at approximately 5x of the “Dead + Self Weight” Load Combination.
In the real world, despite the best efforts of the crew designing, constructing, and maintaining our infrastructure, the likelihood of ‘perfect’ geometry or ideal material properties is small. Also, girders may have been damaged during construction, or operation, settlement may have occurred, construction and manufacturing errors may lead to slight out of plumbness in the components, etc. So, how can we account for potential imperfections?
One way is to perturbate the model in such a way to introduce some form of geometric imperfection. Let’s use an example where a vehicle strikes one of the girders on the bottom flange and causes some lateral deformation. With that lateral deformation, the gravity loads will no longer be resisted by perfectly plumb girders, and this is something we could represent in our model without too much effort.
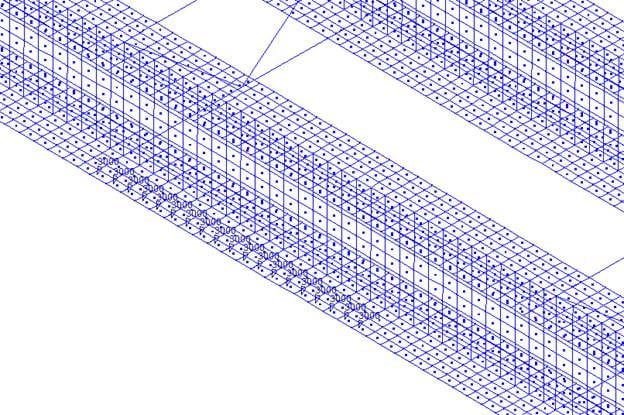
For the sake of this exercise, let us assume one girder had its bottom flange experience 57kips of lateral force in a concentrated area as shown below.
We can then run a linear static analysis on this lateral load case to compute the deformation.
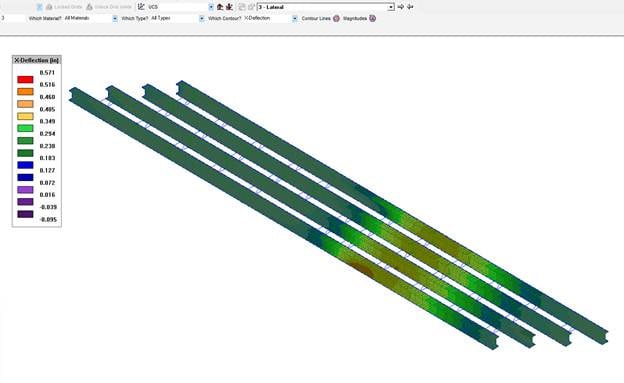
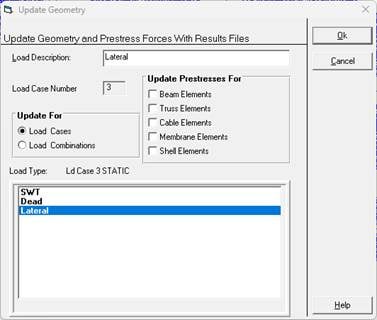
We can see the maximum X-deflection is 0.571”, which is about 40% of the original vertical deformation from a linear static analysis. The next step is to update the analysis model with the geometry from this deflected shape. We are assuming that the lateral deformations are permanent, and our new equilibrium shape will be that of the deflected model.
With the updated geometry, we can now run through a similar nonlinear, and observe the results. In this scenario we noticed nearly identical behaviour for most of the simulations on the undeformed geometry. With that said, when we ran the amplified (8x) load nonlinear static analysis, we did observe an earlier onset of ‘buckling’ behaviour for this model.
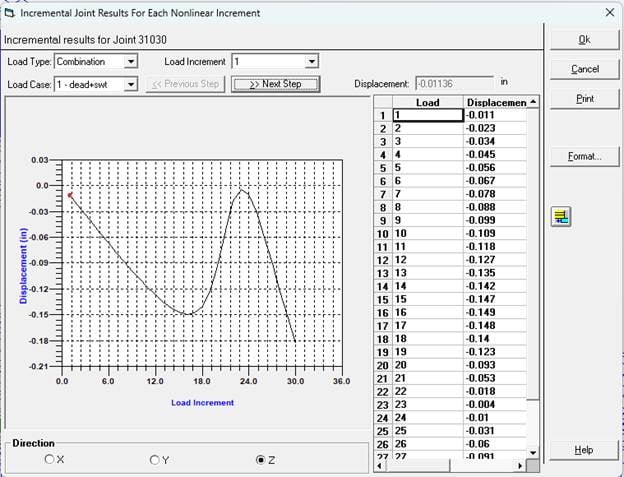
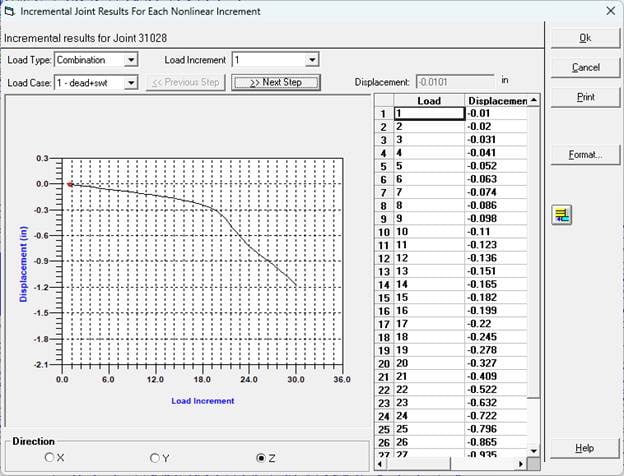
As we can see from the incremental results, the Z-deformation has a sharp increase at load increment 14, which would equate to a load factor of approximately 3.7 times the original load combination.
What Have We Learned: After introducing a geometric imperfection, the Nonlinear Static analyses, predicts that buckling will occur at approximately 3.7x of the “Dead + Self Weight” Load Combination.
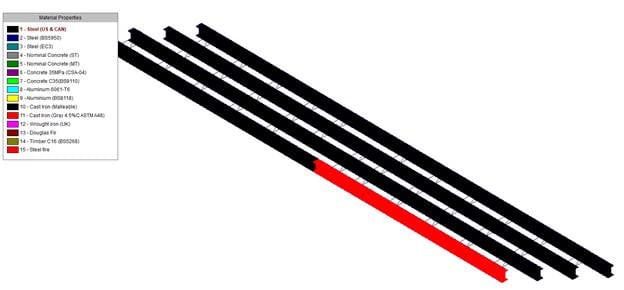
Finally, we will look at one other approach that is derived from our original, ‘idealized’ geometry. We can imagine a scenario where a vehicle fire underneath the bridge caused some localized damage to a portion of one of the girders. In this case, we will assume that the damage is represented by an adjusted material property where the Young’s Modulus of the Steel material in the affected area is reduced by 15%.
For this model, we did not observe a significant difference in incremental results between the original model, and the observed ‘buckling’ point was around 5.0x the applied load.
What Have We Learned: After introducing a material imperfection in a concentrated area of the bridge, the Nonlinear Static analyses, predicts that buckling will occur at approximately 5.0x of the “Dead + Self Weight” Load Combination.
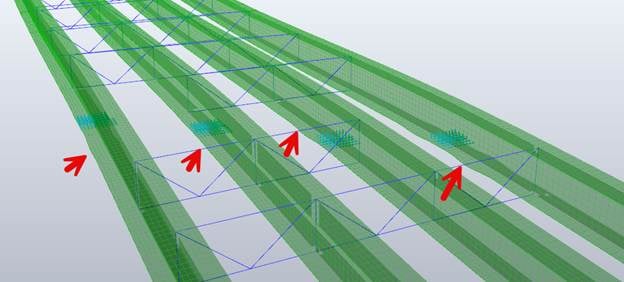
Buckling appears concentrated around the bottom flange of the girders near the interior supports. This makes sense, as the deflection caused by the applied loading would cause that flange to go into compression and thus reduce its buckling capacity.
P-Delta and Nonlinear Static can differ and there are no rules that one must result in lower or higher buckling loads. It will depend on the specific structure and loading.
In Conclusion:
Using modern-day structural analysis software we explored buckling behaviour in our hypothetical bridge. Performing a free-vibration analysis allowed us to better understand the dynamic characteristics of our model to better predict our structure’s response to loads.
We then performed a suite of analysis ranging from linear static to incremental nonlinear static analysis. We observed that under the 60 psf dead loads, and self weight loading, there was minimal difference between linear, p-delta, and nonlinear static analysis. This correlates with the P-Delta Buckling Analysis result which indicates that the magnitude of the Dead Load + Self Weight loading would need to be nearly doubled to cause a buckling failure. We can conclude that from a buckling perspective the structure was not susceptible to buckling failure under the applied loading.
To illustrate the buckling phenomena we chose to increase our loading magnitude by a factor of 8x, and perform the incremental nonlinear analysis once again. This magnitude was deliberately chosen to be over the predicted euler buckling limit calculated from P-Delta Buckling Analysis. We were able to observe a range of buckling limits interpreted from the incremental displacement plot based off ‘perfect’ geometry, laterally deflected geometry, and material variations. We observed that the laterally deflected geometric model produced the lowest ‘buckling’ onset from the nonlinear incremental analysis at a factor of about 3.7x our original load magnitude.
The nonlinear static analysis can be considered the most accurate due to its ability to update both the stress stiffness and geometry matrices for each load increment. With this in mind, we found that the P-Delta Buckling Analysis, for this application was more conservative than nonlinear static analysis with a lower critical buckling mode. This is not always the case, and there is no rule stating that one analysis type will always yield more conservative results. We also observed how a more accurate analysis model, with realistic geometry can influence the buckling behaviour as well, and should be reflected in the analysis model, when possible.
