Altair Compose supports the creation of Graphical User Interfaces (GUIs) to simplify and streamline workflows that will be executed repeatedly or by someone unfamiliar with tools like Compose or other IDEs.
Most tasks in Compose can be executed running scripts and updating relevant file paths and variable values, but they can also run using an interactive GUI, greatly simplifying the process for users. Some examples:
- Visualizing and pre-processing input data for a simulation.
- Running simulations in batch and displaying animations.
- Post-processing simulation results files
To showcase how to do this, I’ve put together this simple example. All relevant files can be downloaded from this article. Links to other GUI examples can be found at the end.
Simple GUI for selecting and plotting signals from a CSV
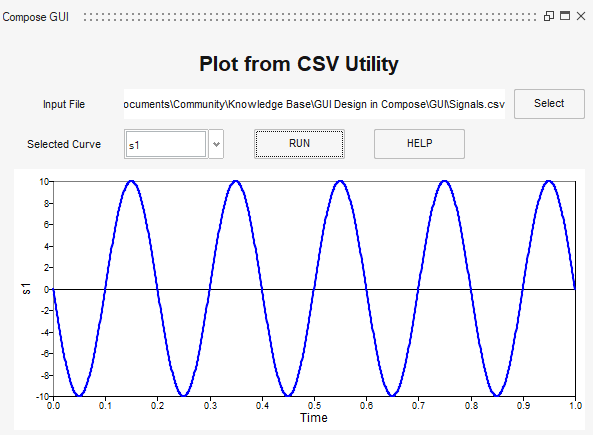
The GUI that I’ll be using as an example is very simple:
- It takes in a CSV file as input by clicking Select.
- It identifies all available time-domain signals and lets the user select the one to plot.
- Clicking RUN plots the signal.
- Clicking Help displays some simple usage instructions in a dialog window.
Designing the user interface with UI Designer
The easiest way to define the user interface of a GUI is to use the UI Designer. This utility can be found in the ribbon toolbar in Compose, under the section GUI Utilities:

The GUI Designer allows users to drag and drop components into the user interface, select a separate OML script where functions are defined, define size and position of all objects, etc.
For this example, I used:
- 3 push button objects for user interaction (selecting input file, running and displaying help)
- 4 text displays, e.g., “Plot from CSV Utiliy”, “Input File”, “Selected Curve”
- Pop up menu for showing and selecting available signals
- UI Panel for displaying plot
The name of all graphics objects as well as properties like their size, position, and tag can be defined here. A few important comments:
- Property “tag” is useful for objects to interact between themselves and get/set properties between each other. E.g, when clicking a button, updating the text of another object, etc.
- In the UI Designer, I’ve also defined a separate OML script to contain all helper functions. Those are the functions that run whenever the object is triggered. e.g., the helper function of the RUN button in this GUI plots a curve.
- Units for an object’s position and size can be set up to either “normalized”, which means it is defined as a normalized proportion of the screen, or “pixel”, raw quantities like width in pixels, length in pixels, etc. I prefer using pixels because it’s easier for me to line everything on a fine grid.
This is how this simple GUI can be defined in the UI Designer:

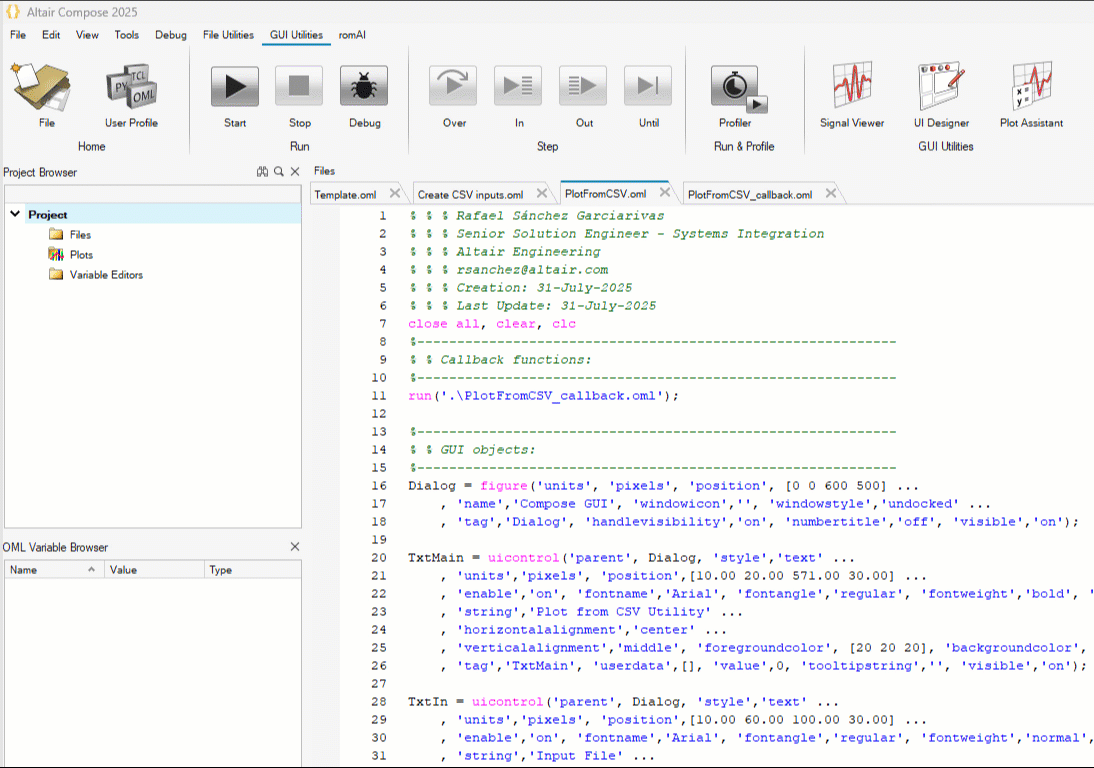
Once the layout of the GUI is ready, it should be saved as both .ui, for any other required changes on the layout, and as .oml, as this is the Compose script that will execute the GUI.
Once the layout is saved as a .oml file, a main script will be created, as well as one containing all callback functions if the user selected a separate script for that:
Main script
This script contains the object properties definition for each object. Something like this:

This is the script that should be run in order to use the GUI. This script runs the callback functions script as well.
Callback functions script
This script contains all functions that define the behavior of the GUI. In this case, these are the callback functions:

This function lets users choose an input CSV file in an interactive window, prints the file path in the input file text box, identifies signals available inside it, and adds those as options in the pop-up menu.

This is the main function which gets the selected input file and signal to read and plots it in the UI panel.

This function reads the content of a text file using function type() and displays it on a message window.
There is another callback function for the pop-up menu, but it is empty as it is not needed for this GUI.
Usage example
As you can see, this GUI was easy to set up. Look at this short video on how to use it:
I hope this example works as a starting point for anyone interested in simplifying or streamlining workflows using Compose.
More information can be found here:
Relevant files can be found here: