The Siemens Community Catalyst program was co-created with our community to acknowledge technology leaders who consistently contribute to the Siemens Community. Nominations are accepted on a rolling basis.
I am trying to plot the force vs displacement curve in the DOE hyperstudy using my LS dyna simulation. ds_9 is the force vector and ds_10 is the displacement vector. However, I'm not able to find the function in Templex that will plot(ds_10, ds_9).
Hi @Manik,
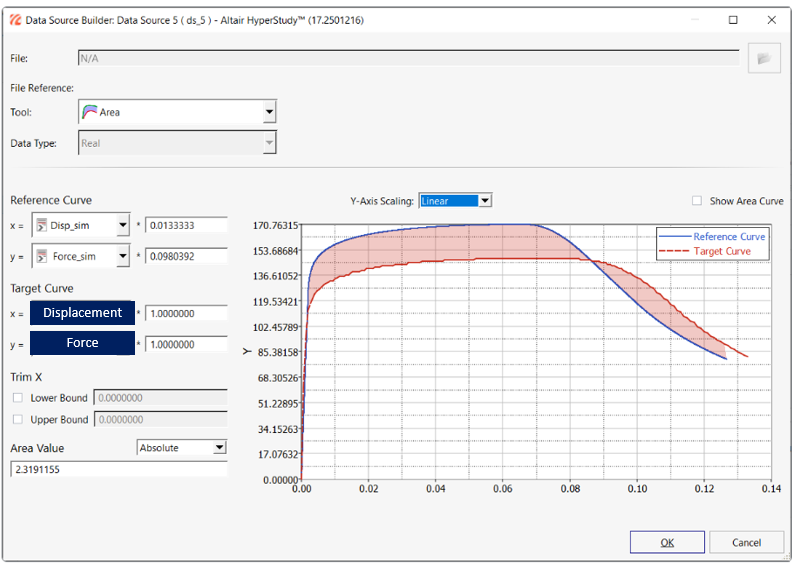
If one needs to only visualize the Force vs Displacement graph, then, one can leverage the 'Area' datasource type (as shown below).
Note: In the below image, there are two plots, but in your setup, if the same individual data sources are added under the 'Reference Curve' & 'Target Curve', only single graph will be shown.
Subsequently, the graphs can be visualized for a DOE/Optimization study using the 'Area' tab (as shown below) in the 'Post-Processing'.
Many thanks.
Kind Regards
Garima Singh
Engineering Data Science
Hi @Garima_Singh
Thanks, but I want to extract the data from force vs displacement curve for my JSON file. For that I have to use the templex functions