How can I see multicollinearity?

soheepark
soheepark New Altair Community Member
edited November 2024 in Community Q&A
Hi, I'm a beginner.

I have a total of 17,379 row data.
I clicked to check the spatter matrix and heatmap because I wanted to check the relationship between variables.

But I couldn't see the scatter matrix and the heatmap.
Because the following text was displayed.

<heatmap>
Plot Heatmap does only support more than 2,000 rows if aggregation is enabled.
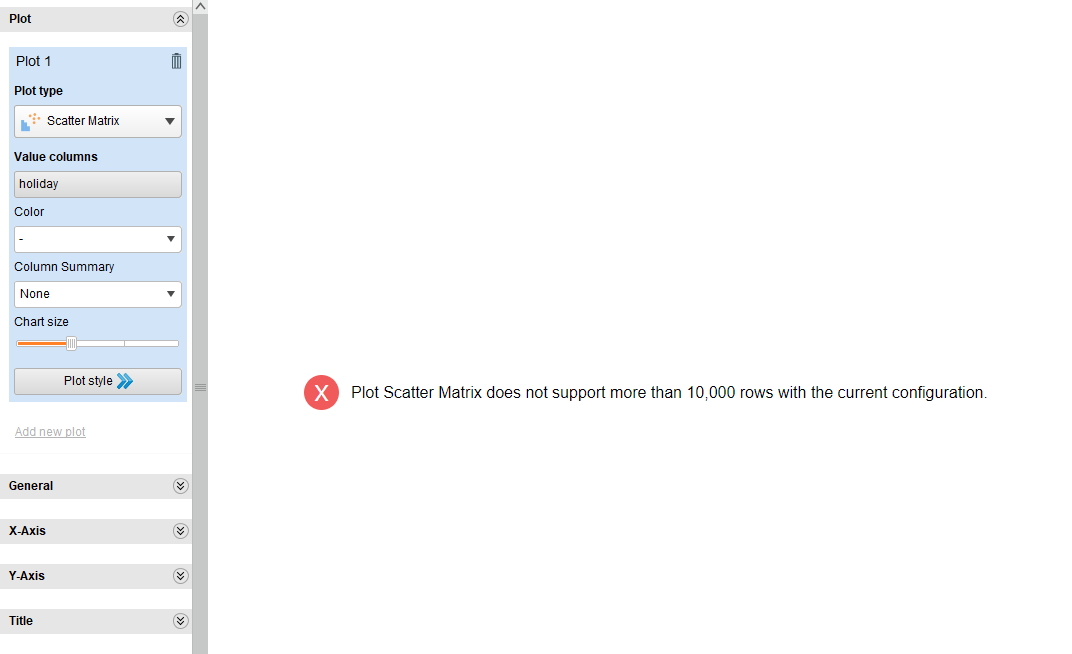
<scatter matrix>
Plot Scatter Matrix does not support more than 10,000 rows with the current configuration.

My data is time series data, and because it is time-based data from 2011-2012,
It is also ambiguous to cut the data to about 2,000 pieces.

In this case, what should I do?

Additionally, how can the VIF value be calculated in the Rapidminer?

I ask for an answer.
Thank you.


Tagged:

Best Answer

  • BalazsBaranyRM
    BalazsBaranyRM New Altair Community Member
    Answer ✓
    Hi!

    In the Preferences (Settings => Preferences => User Interface) there's a setting "Visualizations row limit modifier". You can input higher values there if you are confident that your computer should be powerful enough to process and visualize more data. This is a safety limit to avoid overwhelming older computers.

    With higher limits you should be able to get the charts you need.

    About the VIF factor: RapidMiner is not a classical statistic application. It doesn't do regression analysis like those programs do.
    That said, this could be calculated in a process according to the formula in https://www.statisticshowto.com/variance-inflation-factor/ by looping through the attributes, doing the regression with the current attribute being the label, getting the R² values and calculating the VIF.

    Regards,
    Balázs

Answers

  • BalazsBaranyRM
    BalazsBaranyRM New Altair Community Member
    Answer ✓
    Hi!

    In the Preferences (Settings => Preferences => User Interface) there's a setting "Visualizations row limit modifier". You can input higher values there if you are confident that your computer should be powerful enough to process and visualize more data. This is a safety limit to avoid overwhelming older computers.

    With higher limits you should be able to get the charts you need.

    About the VIF factor: RapidMiner is not a classical statistic application. It doesn't do regression analysis like those programs do.
    That said, this could be calculated in a process according to the formula in https://www.statisticshowto.com/variance-inflation-factor/ by looping through the attributes, doing the regression with the current attribute being the label, getting the R² values and calculating the VIF.

    Regards,
    Balázs