The Siemens Community Catalyst program was co-created with our community to acknowledge technology leaders who consistently contribute to the Siemens Community. Nominations are accepted on a rolling basis.
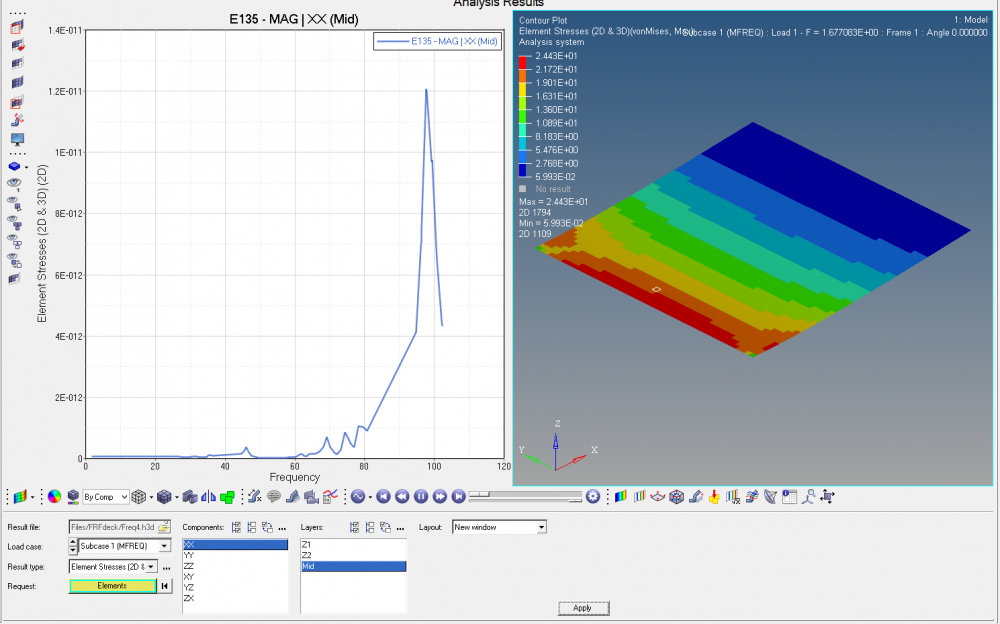
While plotting element stress results for Von Mises stresses, all I see here are options to view the XX, YY, ZZ, XY, YZ and ZX stresses. Please let me know how to plot a Vonmises Vs Frequency plot.
Hi,
What kind of analysis are you doing?. Is it FRF?
Yes, It is a frequency response analysis
Hi Radha,
You can use build plots in HyperView to plot Stress Vs Frequency curve.
<?xml version="1.0" encoding="UTF-8"?>
Hi Prakash,
Thank you, but i have already tried this in hyperview and no plot was showing up after being animated. So I opened the .h3d file in hypergraph and i was able to plot for XX,YY, ZZ, XY YZ,ZX Vs Freq. But, I am looking to plot Vonmises stress vs frequency.
@Radha
I get it. I will check if there is a way to output Vonmises Vs Freq to HG.
Please see this video:
Unable to find an attachment - read this blog
Hello, can the link to this blog be shared again on how to accomplish what is being asked here? I am in the same situation and would like to know how to accomplish this. Thank you.
Once you have a measure you in Hyperview, you can plot it to view in Hypergraph
also available in the Measure Review