This is my online retail data set with 100,000 examples.

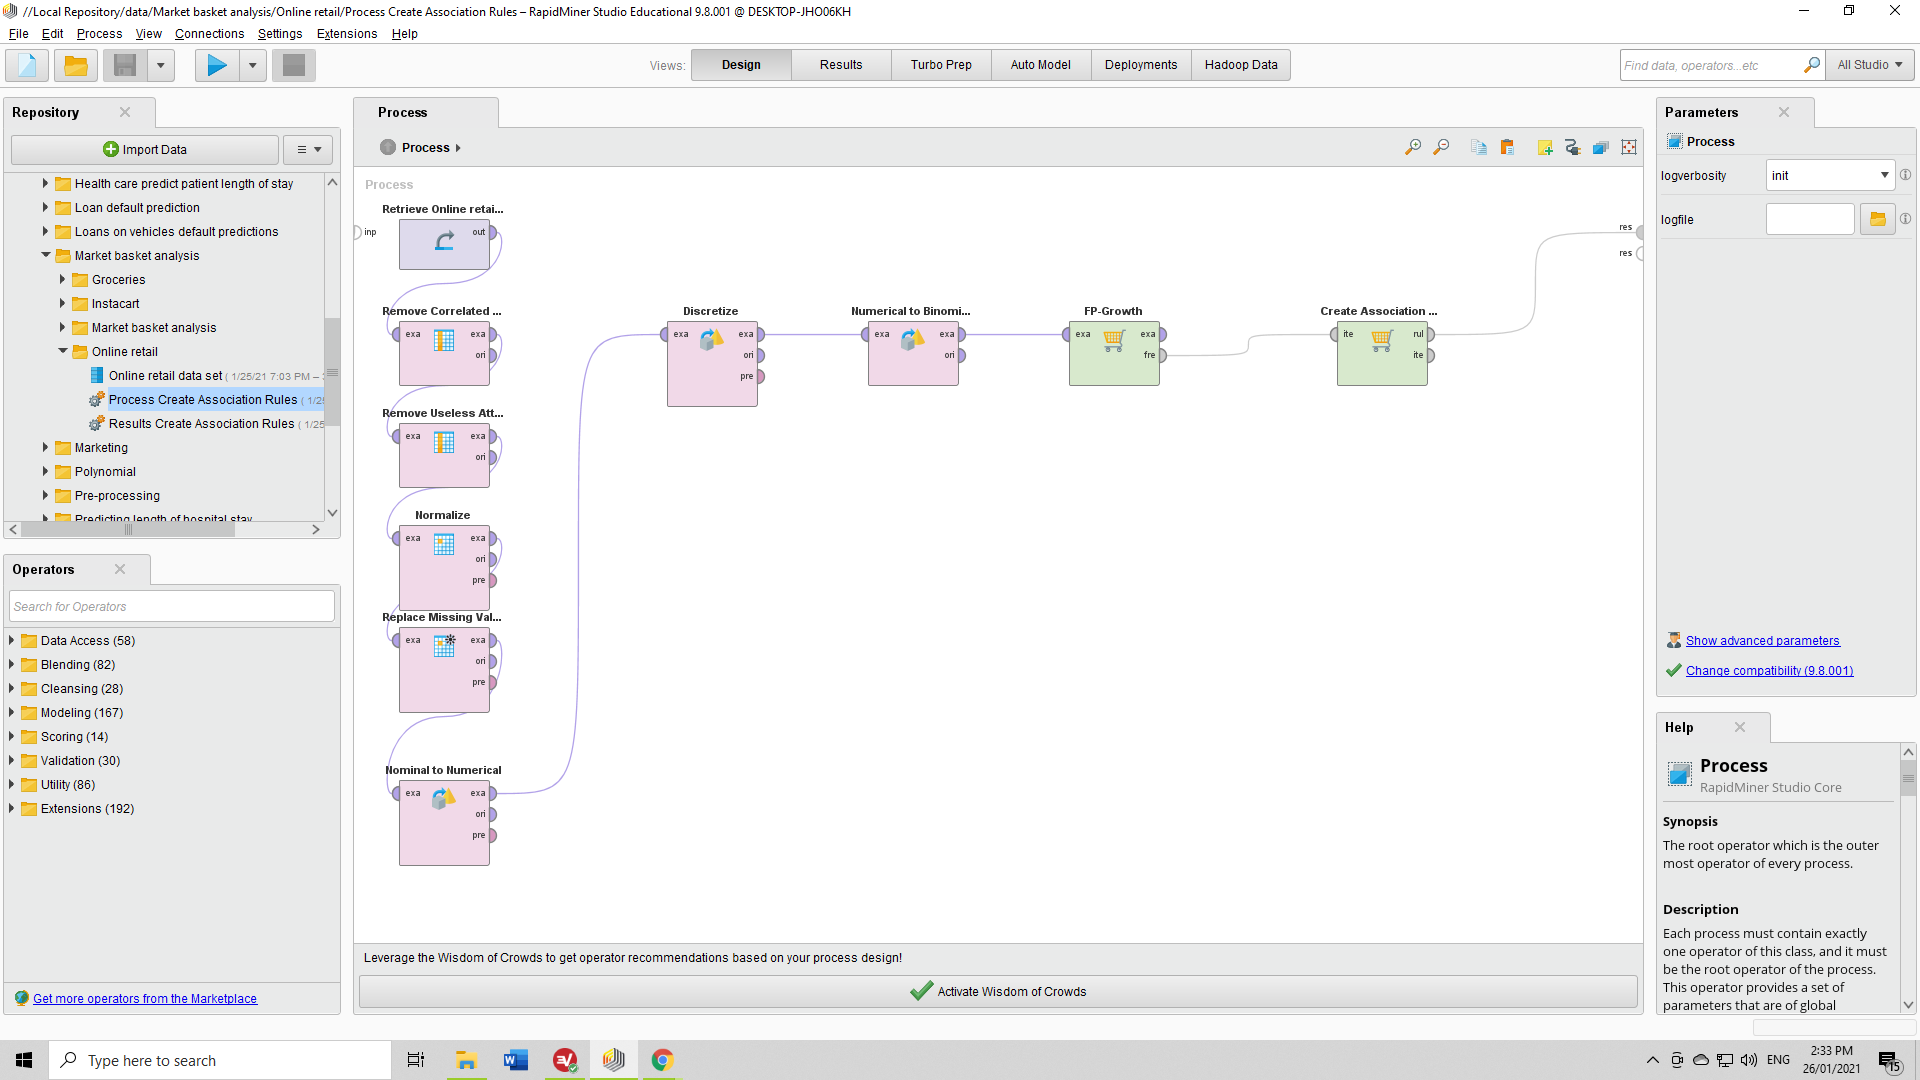
This is my process with operators, Pre-processing to the left, then Discretize, Numerical to binomial, FP-Growth and Create Association Rules.

Executed, this is the process Results. I understand I can click on support, confidence or lift, high to low or low to high, and see different rankings for each row number. What do the different Ranges mean, and is Conclusion the same as Prediction?
