I would like to do a principal component analysis of the taste of ramen.
If I have a score for each noodle(면), the shape (size) of the ramen bowl(그릇), and the taste of the broth(국물), let's perform a PCA analysis with three variables (noodle, bowl, broth).
THIS IS EIGENVECTORS

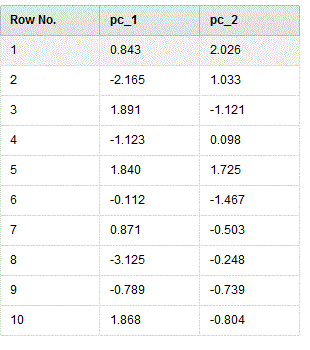
THIS IS EXAMPLE SET PCA DATA
THIS IS EIGENVALUES

THIS IS READ EXCEL EXAMPLE SET DATA

I tried to draw a graph after getting the PCA, but I'm not sure if the graph is correct.
In addition I don't know what the PCA represents. How can I interpret the graph? Can you help me?
