Analysis and normalization of instantaneous data
student_compute
New Altair Community Member
Hello friends
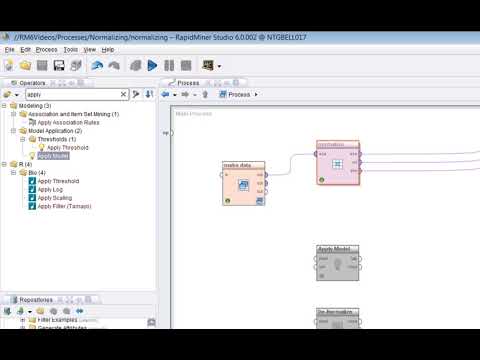
I have a sensor that gives me information at any time (10 milliseconds once). E.g. x, y I have thousands of these x and y. I know clustering and classification in rapidminer.
I ask experienced friends
What suggestions do you have for this data?
How can I predict x, y?
And analyze the data?
I ask you to help me
Thanks to the very good rapidminer
Tagged:
0
Answers
-
You are going to want to look at some kind of feature selection. I would recommend one of the variance reduction techniques, like PCA. You will have a lot of redundant overlap in data that is taken so frequently.
What is it that you are trying to do with this data---predict some outcome?0 -
HelloThank you so much for your helpI have my data in this wayIt's time to be in a pillarInsert x in a column and type y in a columnlike this:time x y
-----------------------21 45 8
35 52 12Now I do not know how to normalizeAnd I can predict values of x, y at a later time?Or do I analyze the data?If anyone has experienceMaybe helpThankful0 -
Take a look at the new Time Series operators, they are part of the standard Studio operator set.
There is an operator for Normalizing time series data. There are also operators for forecasting time series data such as ARIMA or Holt-Winters. I would probably start with ARIMA.
0 -
HelloI am a beginner in this caseMay you give me more guidance?Tutorial to introduce me?Thank you so much0
-
Take a look at the ARIMA examples, specifically the ARIMA model for Lake Huron. To better understand ARIMA, do a search on Rob Hyndman. He wrote the forecast package for R and there are a lot of examples that you could duplicate in Rapidminer. You will have to understand normalization and what it means for your time series to be stationary. Don't take this part lightly as it can make or break your forecast.
2 -
Hellothanks for your helpI searched a lot about the time seriesBut it is still ambiguous to meMy data is as below.I do not know how to normalize the data in the RapidMiner program. And does not need normalization at all?How to stack the series?How to use ARIMA? So I can predict the x and y values at a later time?I ask you to help meThankful
best regard0 -
Did you look at the operators to see what they do? @student_compute, I have read a lot of your posts and you seem quite lost. Unfortunately, there are no shortcuts. You have to put in the time to learn the material. Is this for school? There are already standard ARIMA examples. It would be helpful if you could be more specific about what exactly you are having difficulty with. Do you understand what normalization means? Do you understand why a time series might need to be de-trended? When your question is so broad, it is hard to figure out where to begin. Post a process. That is the best way to get help. It is much quicker to solve problems that way.
4 -
Hallo student_compute,Take 15mn to look this trainingHow to normalize data in RapidMiner by Markus Hofmann.I enclose as well an example given some months ago in the RM Forum:<?xml version="1.0" encoding="UTF-8"?><process version="9.1.000">
<context>
<input/>
<output/>
<macros/>
</context>
<operator activated="true" class="process" compatibility="9.1.000" expanded="true" name="Process">
<parameter key="logverbosity" value="init"/>
<parameter key="random_seed" value="2001"/>
<parameter key="send_mail" value="never"/>
<parameter key="notification_email" value=""/>
<parameter key="process_duration_for_mail" value="30"/>
<parameter key="encoding" value="SYSTEM"/>
<process expanded="true">
<operator activated="true" class="retrieve" compatibility="9.1.000" expanded="true" height="68" name="Retrieve Sonar" width="90" x="45" y="85">
<parameter key="repository_entry" value="//Samples/data/Sonar"/>
</operator>
<operator activated="true" class="set_role" compatibility="9.1.000" expanded="true" height="82" name="Set Role" width="90" x="179" y="85">
<parameter key="attribute_name" value="class"/>
<parameter key="target_role" value="label"/>
<list key="set_additional_roles"/>
</operator>
<operator activated="true" class="concurrency:cross_validation" compatibility="9.1.000" expanded="true" height="145" name="Cross Validation" width="90" x="380" y="85">
<parameter key="split_on_batch_attribute" value="false"/>
<parameter key="leave_one_out" value="false"/>
<parameter key="number_of_folds" value="10"/>
<parameter key="sampling_type" value="automatic"/>
<parameter key="use_local_random_seed" value="false"/>
<parameter key="local_random_seed" value="1992"/>
<parameter key="enable_parallel_execution" value="true"/>
<process expanded="true">
<operator activated="true" class="normalize" compatibility="9.1.000" expanded="true" height="103" name="Normalize" width="90" x="112" y="136">
<parameter key="return_preprocessing_model" value="false"/>
<parameter key="create_view" value="false"/>
<parameter key="attribute_filter_type" value="all"/>
<parameter key="attribute" value=""/>
<parameter key="attributes" value=""/>
<parameter key="use_except_expression" value="false"/>
<parameter key="value_type" value="numeric"/>
<parameter key="use_value_type_exception" value="false"/>
<parameter key="except_value_type" value="real"/>
<parameter key="block_type" value="value_series"/>
<parameter key="use_block_type_exception" value="false"/>
<parameter key="except_block_type" value="value_series_end"/>
<parameter key="invert_selection" value="false"/>
<parameter key="include_special_attributes" value="false"/>
<parameter key="method" value="Z-transformation"/>
<parameter key="min" value="0.0"/>
<parameter key="max" value="1.0"/>
<parameter key="allow_negative_values" value="false"/>
</operator>
<operator activated="true" class="h2o:logistic_regression" compatibility="9.0.000" expanded="true" height="124" name="Logistic Regression" width="90" x="246" y="34">
<parameter key="solver" value="AUTO"/>
<parameter key="reproducible" value="false"/>
<parameter key="maximum_number_of_threads" value="4"/>
<parameter key="use_regularization" value="false"/>
<parameter key="lambda_search" value="false"/>
<parameter key="number_of_lambdas" value="0"/>
<parameter key="lambda_min_ratio" value="0.0"/>
<parameter key="early_stopping" value="true"/>
<parameter key="stopping_rounds" value="3"/>
<parameter key="stopping_tolerance" value="0.001"/>
<parameter key="standardize" value="true"/>
<parameter key="non-negative_coefficients" value="false"/>
<parameter key="add_intercept" value="true"/>
<parameter key="compute_p-values" value="true"/>
<parameter key="remove_collinear_columns" value="true"/>
<parameter key="missing_values_handling" value="MeanImputation"/>
<parameter key="max_iterations" value="0"/>
<parameter key="max_runtime_seconds" value="0"/>
</operator>
<connect from_port="training set" to_op="Normalize" to_port="example set input"/>
<connect from_op="Normalize" from_port="example set output" to_op="Logistic Regression" to_port="training set"/>
<connect from_op="Normalize" from_port="preprocessing model" to_port="through 1"/>
<connect from_op="Logistic Regression" from_port="model" to_port="model"/>
<portSpacing port="source_training set" spacing="0"/>
<portSpacing port="sink_model" spacing="0"/>
<portSpacing port="sink_through 1" spacing="0"/>
<portSpacing port="sink_through 2" spacing="0"/>
</process>
<process expanded="true">
<operator activated="true" class="apply_model" compatibility="9.1.000" expanded="true" height="82" name="Apply Model" width="90" x="112" y="85">
<list key="application_parameters"/>
<parameter key="create_view" value="false"/>
</operator>
<operator activated="true" class="apply_model" compatibility="9.1.000" expanded="true" height="82" name="Apply Model (2)" width="90" x="246" y="34">
<list key="application_parameters"/>
<parameter key="create_view" value="false"/>
</operator>
<operator activated="true" class="performance" compatibility="9.1.000" expanded="true" height="82" name="Performance" width="90" x="380" y="34">
<parameter key="use_example_weights" value="true"/>
</operator>
<connect from_port="model" to_op="Apply Model (2)" to_port="model"/>
<connect from_port="test set" to_op="Apply Model" to_port="unlabelled data"/>
<connect from_port="through 1" to_op="Apply Model" to_port="model"/>
<connect from_op="Apply Model" from_port="labelled data" to_op="Apply Model (2)" to_port="unlabelled data"/>
<connect from_op="Apply Model (2)" from_port="labelled data" to_op="Performance" to_port="labelled data"/>
<connect from_op="Performance" from_port="performance" to_port="performance 1"/>
<connect from_op="Performance" from_port="example set" to_port="test set results"/>
<portSpacing port="source_model" spacing="0"/>
<portSpacing port="source_test set" spacing="0"/>
<portSpacing port="source_through 1" spacing="0"/>
<portSpacing port="source_through 2" spacing="0"/>
<portSpacing port="sink_test set results" spacing="0"/>
<portSpacing port="sink_performance 1" spacing="0"/>
<portSpacing port="sink_performance 2" spacing="0"/>
</process>
</operator>
<connect from_op="Retrieve Sonar" from_port="output" to_op="Set Role" to_port="example set input"/>
<connect from_op="Set Role" from_port="example set output" to_op="Cross Validation" to_port="example set"/>
<connect from_op="Cross Validation" from_port="model" to_port="result 3"/>
<connect from_op="Cross Validation" from_port="test result set" to_port="result 1"/>
<connect from_op="Cross Validation" from_port="performance 1" to_port="result 2"/>
<portSpacing port="source_input 1" spacing="0"/>
<portSpacing port="sink_result 1" spacing="0"/>
<portSpacing port="sink_result 2" spacing="0"/>
<portSpacing port="sink_result 3" spacing="0"/>
<portSpacing port="sink_result 4" spacing="0"/>
</process>
</operator>
</process>Bonne chance,Maerkli
3 -
In addition to the video and process kindly posted by @Maerkli, with time series data, you will need to know what first order differencing is and why you might need to use a moving average to de-trend your data. You will have to understand your data first so plot it out and take a look.
3 -
Hallo Hughes,Thanks for the link.MaerkliPS. C'est du lourd.0
-
Hello to allThank you very much for helping my dear friendsI am a beginner in time series.I studied the basic conceptsBut it is difficult to understand and generalize the concepts of theory to practicalMy data is related to a sensor that is received at different times.I want to anticipate new values for later on these dataBut do not know where to startSo, I asked experienced friends at the forum for help.I'm sure to try to create a process. So friends can guide me.Thank you allgood day0
-
Hallo Student_compute,If your data are not confidential, share them with the RapidMiner community and explain exactly what you want. I am sure that many people are going to help you out. CSV format is very convenient.Maerkli0
-
hello
I was busy with my exams for a whileMy data is as followsI want to analyze this dataBut do not know howDo not I need to use clustering or classification or time series?Can you help me solve this problem?I need helpThanks if you have any help0 -
Are you trying to predict quality score as a function of time? If so then try looking at the data with the time series operators. You can plot this series and look at it using the Classic Decomposition operator or the Moving Average operator to detect patterns in the data. Then you can choose an appropriate forecast method such as Holt Winters or ARIMA.
0 -
HelloThank you so much for your replyYes . I want to analyze my data first. And say how data is.Then, for future periods, I predict the quality and I can report the accuracy of the forecast. But do not know how And what operators should I do?I do not know which operators and data mining algorithms I use to analyze this kind of data?Please help my experienced friends present my example.Thankful0
-
@student_compute sorry but we've gone over this many times. You MUST learn how to post your XML and your data sets on this forum: https://community.rapidminer.com/discussion/37047.
Others - you are all too kind. Please note.
Scott
0 -
Yes . You are right.This is an example of my dataBut I'm sorry to say that. I really do not know how to use the time series for analysis and forecasting. I searched in the forum but I do not know how to do it for my data?I know there is a lot of demand and I ask the community to do it for me. I tried a lot. So I can do it myself. That I did not succeed.I request your dear friends, if possible, to help me once more.And provide a process example that will use the time series to analyze and predict my data.And can I use clustering, classification, or Associative rules mining? How?ThankfulSorry for the time of the forumThanks for the good rapidminer and good friends0
-
hello @student_compute - ok THANK YOU for your data. That helps. It looks to me like your data is very straightforward. Hence I would next strongly recommend going through these posts and following Dr. Temme's steps:
https://community.rapidminer.com/discussion/41717/time-series-extension-release-of-the-alpha-version-0-1-2
https://community.rapidminer.com/discussion/42585/time-series-extension-features-of-version-0-1-2
note that the Time Series operators are no longer an extension; they are part of the core.
Scott
cc @eackley290 -
Hellothanks for your helpI saw the linksButQuestions were made to meIs it with this data? Can I predict the next value of quality at a later time by time series?Is there a possibility of clustering?In the links you introduced, I did not see the sample xml file. Is there a sample XML file for me?I really need your helpThank you0
-
HelloDear friends and professorsI hope you are healthyI read the following link belowhttps://community.rapidminer.com/discussion/52339/time-series-extension-features-of-version-0-1-2
And I tried to know and understand a lot.But I could not get the result.What exactly are binom, simple, and what is the purposeThat What are aic, bic, aicc values in the output of samples in the rapidminer program? Great values for them? Or small?I know I have a lot of expectations.But I do not know how to use the time series for their data and their future values?Please guide meDo you give me a useful link to know the concepts of time series and arima in rapidminer?And thatDo you have the examples listed on this link?
https://community.rapidminer.com/discussion/52339/time-series-extension-features-of-version-0-1-2Thank you so muchAndI am waiting for your helpgood day0 -
Hi @student_compute,
As the time series extension is now part of RM Core, you can find the examples mentioned in https://community.rapidminer.com/discussion/52339/time-series-extension-features-of-version-0-1-2 directly in RapidMiner in the Samples/Time Series folder in the repository panel (as well as some more templates showing the functionality added in later updates).
For simple and binom, these are only the names of two different kind of filter weights (simple = all weights the same; binom = expansion of binomial expression, example given in the thread).
For AIC, BIC and AICc please have a look on the operator help text or this wikipedia link (https://en.wikipedia.org/wiki/Akaike_information_criterion).
For a better understanding of time series analysis in general I would suggest this free online text book: https://otexts.com/fpp2/ (Though the author is not using RapidMiner, but still concepts are greatly explained).
Best regards,
Fabian
1 -
Hello dear professorThank you very much for your help and links.I can give you examples of this tutorial.I am a beginner. Maybe you are a respected professor. Please If possible, depending on the data I sent. Send me a simple forecast sample using time series or Arima algorithm? How do you know the process?I'm sorry for my request.Thanks a lotWith respect0
-
1 -
Hi @student_compute,
The templates (of which @hughesfleming68 posted this nice screenshot, thanks by the way) and the free text book I linked, should give you enough insight into learning how to analyse time series data and create forecasts, also for your problems.
By the way, I am in no way a professor, but thanks ;-)
Best regards,
Fabian1 -
HelloBe sure, dear professorthank youI study . I try . In the RapidMiner, I will create a process and send you a reviewThank you for guidance at that time.May I send my email as a private message, so if I'm not in the forum, do I email?ThankfulWith respect0
-
Hello @student_compute
As I said I am not a professor.
Nice to hear that I could help you. If you have further problems, feel free to ask here again in the community.
Best regards,
Fabian
0 -
HelloI tried hard to predict the future values for the quality variable in the RapidMinerI will process my own, according to the data I have already provided. I createdI sent the resultsBut I got confusedI do not know which one is my prediction. And which one is correct and correct?Why are some values "?" In the output?How do I determine the best value for the Arima parameters?Please guide my friendsI do not know the meaning of the graphsThankful0
-
You are making good progress @student_compute. Your forecast of quality is your prediction. You would expect it to be an extrapolation and it is so you are on the right track. Quality and forecast is a join of your input data and your forecast. The question marks just show you where your input ends and your forecast begins. This is normal.
Please read the otexts.org link. It will tell you everything that you need to know about setting values. There really is a mountain of info on the net on this subject.
Keep in mind that forecasting is as much an art as a science. It is not about having the correct forecast. It is about having the least wrong forecast.1 -
Hellothanks for your responseIs my process right?How do I find out which value is best for arima parameters?Should the aic, bic, aicc values be the lowest? These negative values are obtained. It is true?How to use the optimization operator to find the optimal values for arima parameters?And how can I use Svm, decision tree to predict future values of variable quality and report accuracy of prediction and compare results with arima results?Please guidethanks a lot
..
And The book link you mentioned. I saw It is very crowded. And my time is low. I ask you to give me a brief summary, if possible, in which case I would like to thank you very much....0 -
With all due respect @student_compute, all your questions have been covered in previous posts. It is your job to study the material. It is not for us to summarize anything. If you don't have the time, I can guarantee you, no one here has the time either. I posted the link to the material on the 8th of January. You couldn't find one afternoon to read it?3