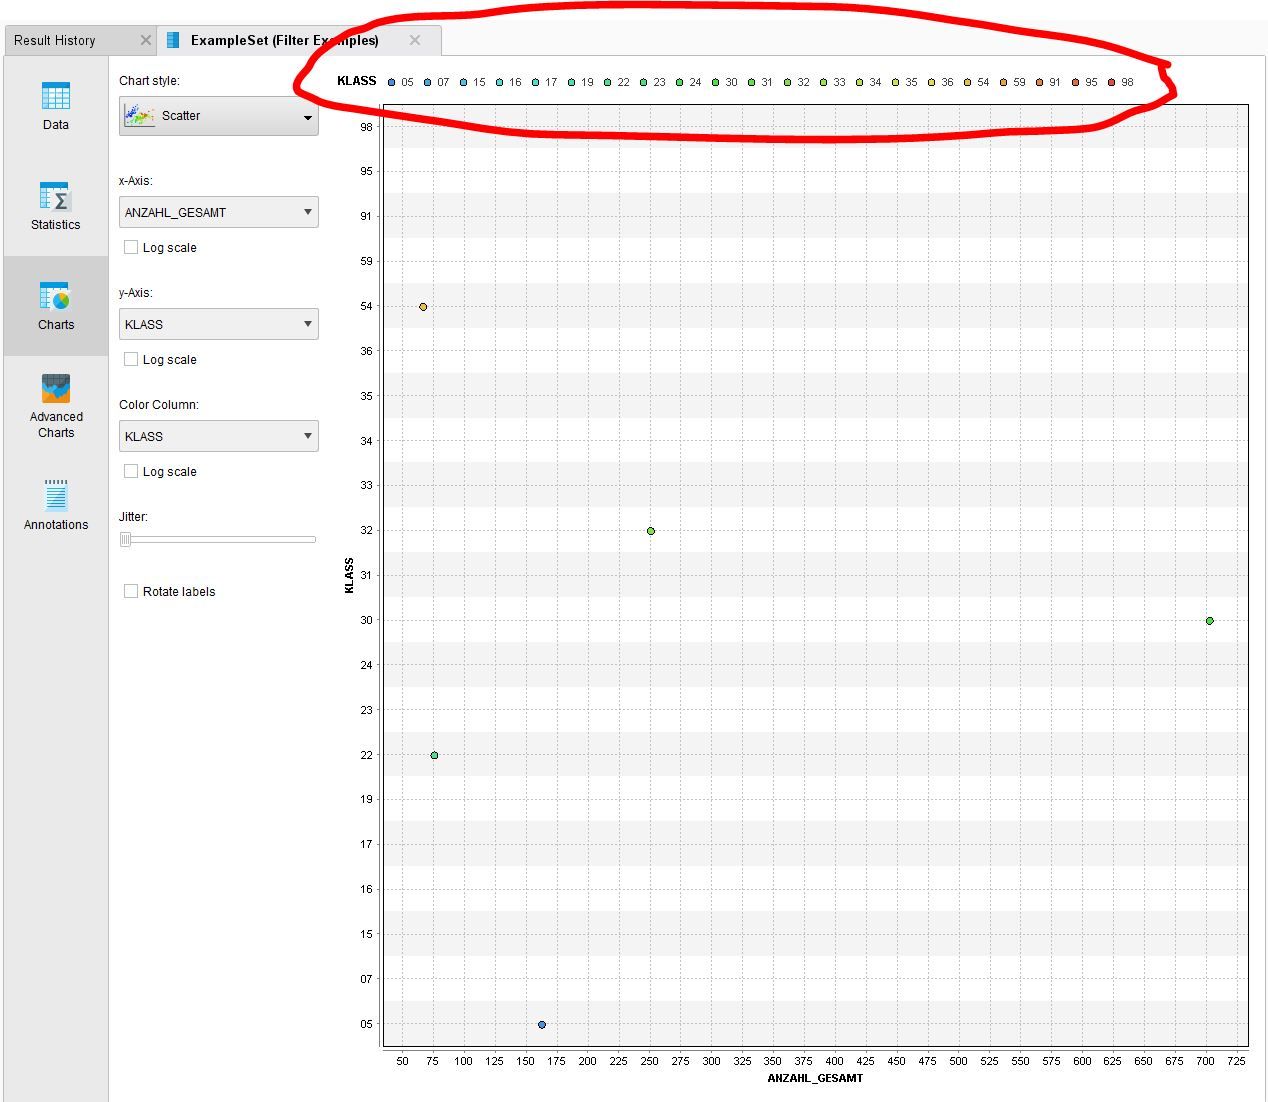
Due to "Filter Examples" are within the graph are fewer points than in the "Color Column". All values are displayed in "Color Column". Only five values in the result set are to be output. How so select values in "Color Column" ?
The other way around. I just wanna see this five values in "Color Column" that apears in the chart.
Thanks!
Thomas

