hi,
to detect outliers in my dataset, I was using the k-nn global anomaly score operator, unfortunately, it does not give any hints how to choose k,
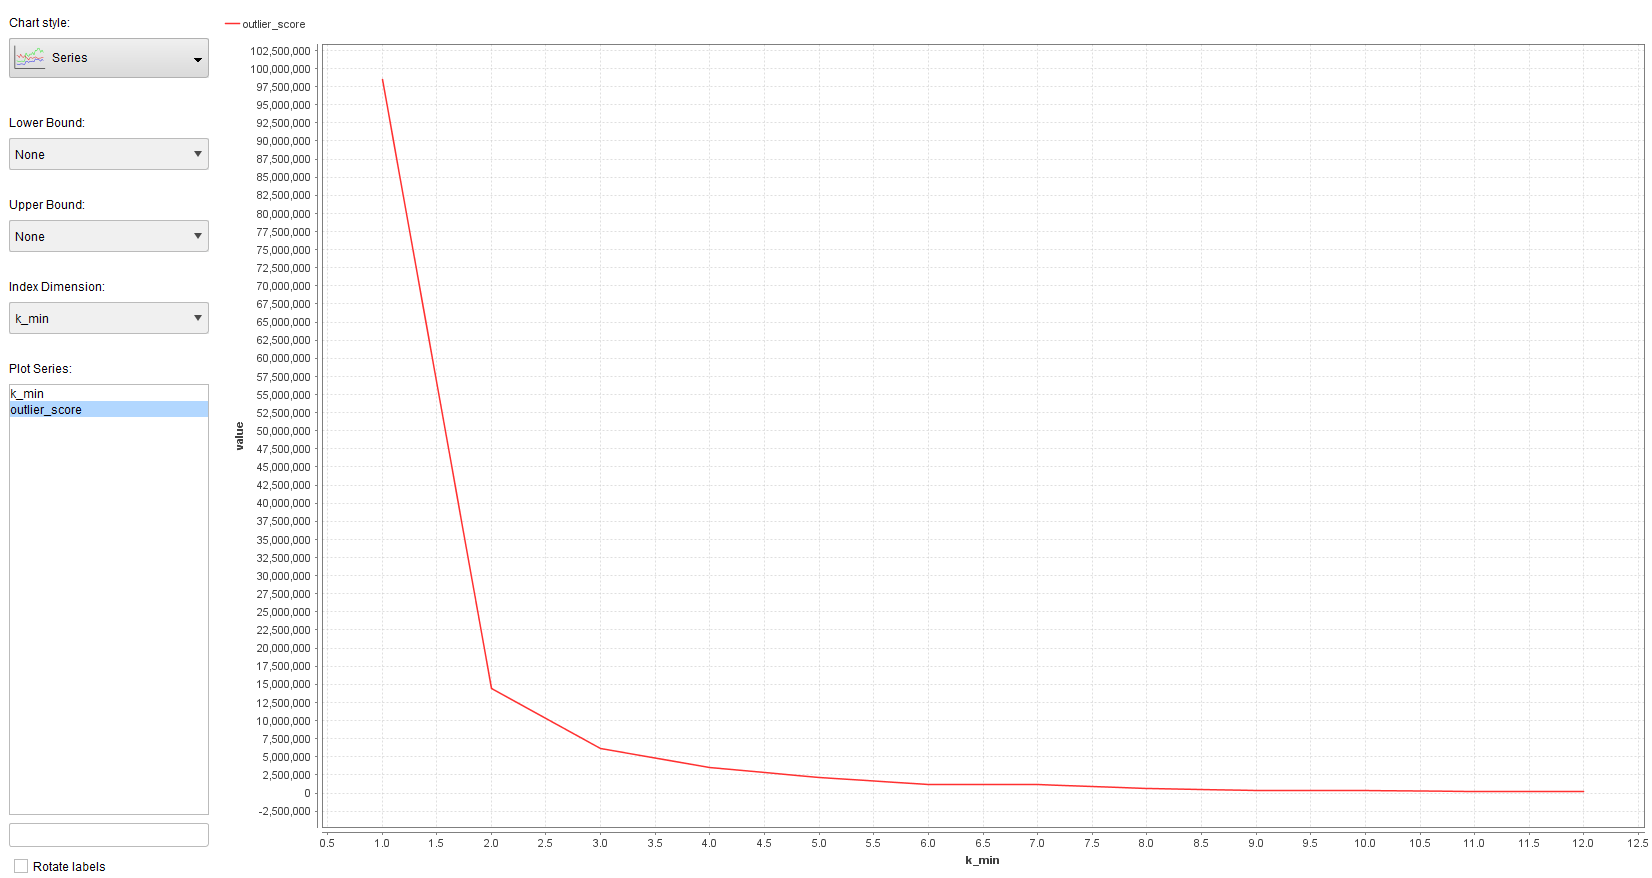
so I put the operator inside a grid optimization to search for different k, and convert the outlier score to a performance vector and log it (screenshot)
 so
so
so I think the algorithm for k-nn GAS works as follows: Either choose the k-th nearest neighbor as distance only or choose the average to the k nearest neighbours.
As I increase k, the outlier score also grows, naturally... I get this graph for different k:

my question is, is there any way to interpret maybe the slope of the graph or something else? How could I interpret this, e.g. the high increase of the slop at
k=1 and equally k = 10? does that have any significance ? should I therefore choose k = 1 or k=10 as the best k?
I get this graph with the Cluster based Local Outlier Factor (CBLOF) with k-means:

I know that with k= 1 its kind of "overfitting", as variance is very high and bias is very low, so does this tell me anything about outliers, or should I go for safety and choose higher k? like k= 2 or k=3 ?