Force Vs Displacement Graph in Hyperview

NoorAlam_08
NoorAlam_08 Altair Community Member
edited November 2020 in Community Q&A

Hi Everyone.

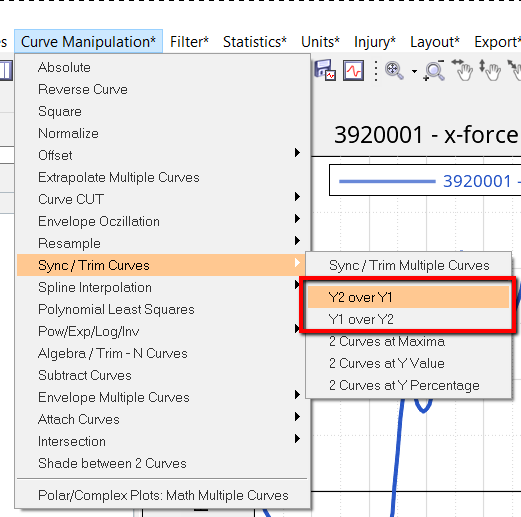
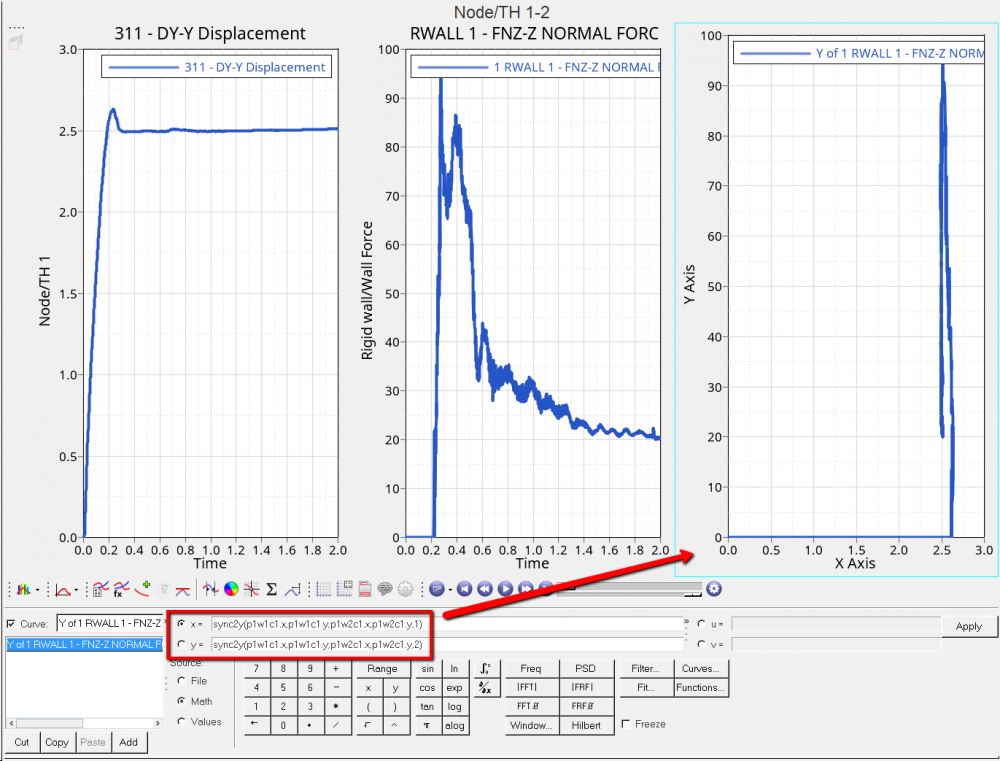
Can anyone help me how can generate force vs displacement graph in hyperview.

I am doing a impact analysis in radioss but i am unable to generate the Reaction force vs Displacement graph.


Can anyone help me the process to generate force vs  displacement graph.


Regards

Noor Alam 

Welcome!

It looks like you're new here. Sign in or register to get started.

Answers

  • PrasannaK
    PrasannaK
    Altair Employee
    edited April 2020

    Hi,


    Kindly find the video link for your reference (demonstrate basic plotting in HV): https://www.youtube.com/watch?v=IdwBQ-YOIr8


    Since you are performing analysis here, you can load the result file (h3d) in HV/HG and plot the graph.


    Thank You

  • NoorAlam_08
    NoorAlam_08 Altair Community Member
    edited April 2020

    Hi. 

    I have generate Reaction Force vs Time And Displacement vs Time graph. 

    But i need from these graph to Reaction force vs Displacement graph.

    Can anybody know how be find this graph.


    Regards 

    Noor Alam

  • Sebastian_Karp
    Sebastian_Karp
    Altair Employee
    edited April 2020

    Hi,


    if you have a base of curves DISP-vs-TIME and FORCE-vs-TIME, and would like to do a crossplot to get e.g. FORCE-vs-DISP, then I recommend one macro / function from the MVP Toolbar (btw I need to check MVP support for Student Editions). One of those:


    grafik.png


    The function is defined in MVP as:


              function sync2y(c1x,c1y,c2x,c2y,flag)
                {
                    min2c  = max(cat(min(c1x),min(c2x)))
                    max2c  = min(cat(max(c1x),max(c2x)))
                    ptsrangec1x = numpts(subrange(cat(c1x,min2c),min2c,max2c))
                    ptsrangec2x = numpts(subrange(cat(c2x,min2c),min2c,max2c))
                    if(ptsrangec1x >= ptsrangec2x)
                        newx = c1x[subrange(c1x,min2c,max2c)]
                    else
                        newx = c2x[subrange(c2x,min2c,max2c)]
                    endif
                if(flag == 1)
                    newy = lininterp(c1x,c1y,newx)
                endif
                if(flag == 2)
                    newy = lininterp(c2x,c2y,newx)
                endif
                    return newy
                }


    The Macros using this function creates a new curve with these vector definitions:


    <?xml version="1.0" encoding="UTF-8"?>grafik.png


    This way, not matching vectors are sychronized, compared to using the definition
    x=p1w2c1.y  /  y=p1w1c1.y 
    as new curve, where e.g. an Offset of original curves would not be recognized. So the way described above should be the clean way to do this.


    Unfortunately I do not find a better documentation for this specific function. Hope this helps.


  • Rogerio Nakano_21179
    Rogerio Nakano_21179 New Altair Community Member
    edited January 2021

    Hi

    If you request the force and the displacement on the given node via /TH, you will be able to create the force vs displacement with HyperGraph.

    Please refer to the Radioss documentation of the keyword /TH

    Regards


Welcome!

It looks like you're new here. Sign in or register to get started.

Welcome!

It looks like you're new here. Sign in or register to get started.