The Siemens Community Catalyst program was co-created with our community to acknowledge technology leaders who consistently contribute to the Siemens Community. Nominations are accepted on a rolling basis.
Hi i have 2 results files, same node number and ID. Is it possible to plot model which is first model stress values - second model stress values? So in the end i see model with stress values (first - second)?
regardsJakub
Hi Jakub,
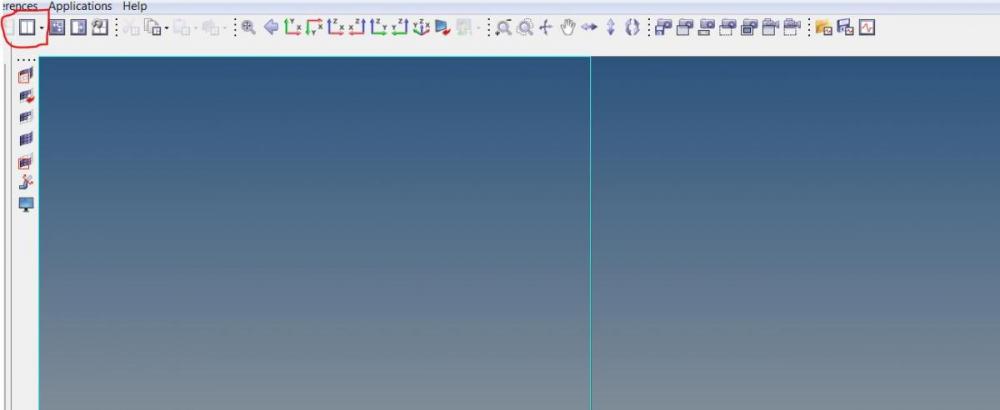
You can load models in two windows using page window layout option.
Please see the attached image
<?xml version="1.0" encoding="UTF-8"?>
yes, that i know, but i would like to have 1 page with visualization values stress 1st model minus strresses of 2nd model
there is no such possibility?
This may not be possible with result math function in HyperView.
I am trying out a workaround with derived load steps options with type as linear superposition assuming you have linear static analysis results, you can have both result files a single HyperView window.
I will update you soon about my findings.
The derived loadstep workaround is working for component stresses.
But, if you are looking at Vonmises combo, V1+V2 is not correct. In linear combination for Von Mises stress you don’t have to check on the scalar value but on the tensor.
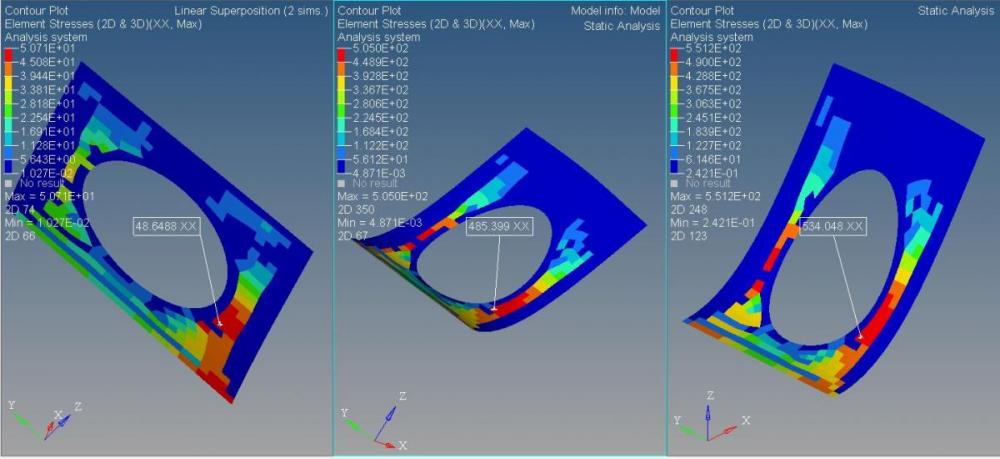
In the attached image the First image on the left is a linear superposition but with a negative scale factor. This means result1-result2 and this matches with the calculation.
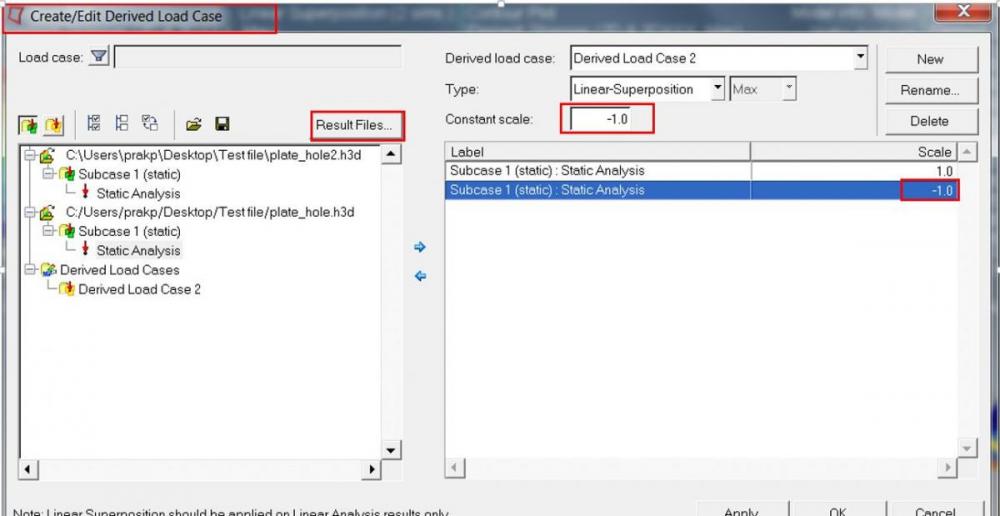
Steps for Workaround:
1) Load the First result file in HyperView and open Derived LoadStep panel
2) In derived loadsteps panel click result file and select the second result file, Now you should see two result files
3) Create a NEW derived loadstep of the type Linear superposition.
4)Select the first result file's load case and add this using the arrows in the panel. Make sure the constant scale factor is set to '1' for this
5) Repeat the same for the second result file's load case but this time the scale factor is '-1'
6) Click apply and Go to Loadstep Result browser and from the drop down select the Derived loadstep you have created and contour for component stresses.
i found out... it is in Derived Results :-)
Works either ways,
Thanks for the update,.
Hi,
Is there a way this could be done for a non linear analysis? for example the belt region of a tyre?
Could you please explain in detail?
Join us for a community conversation on how High-Performance Computing (HPC) and Simcenter PSIM work together to meet the increasing demands of modern power electronics simulation. During this one-hour technical session, you'll discover how leveraging HPC can speed up simulations, improve scalability, and empower engineers…
Join us for a community conversation on accelerating your motor simulation workflow with Simcenter Simlab. In this beginner-friendly session, we'll introduce the platform's automated model-building capabilities and show how easy it is to set up your first electric motor analysis. You'll see the basic steps of geometry…
Join us for a Community Conversation where we'll discuss practical approaches to analyzing complex electromagnetic models using hybrid solver techniques. This session will provide a general overview of how different computational methods can be combined within a single simulation to address models containing varied…