The Siemens Community Catalyst program was co-created with our community to acknowledge technology leaders who consistently contribute to the Siemens Community. Nominations are accepted on a rolling basis.
Which format file we can import in Hyperview NVH Utility for Modal participation Analysis? & What are the cards to activate to extract the output format for modal participation factor analysis from Normal modal analysis / FRF analysis ??
Hi,
Use PARAM EFFMAS to output modal participation factor to .out or .pch file.
Hi Prakash,
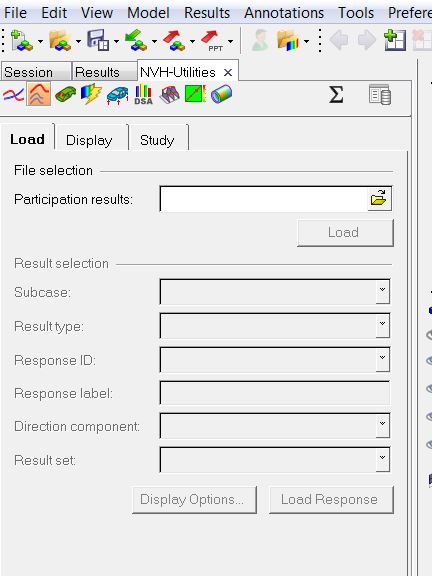
The format file is not able to import in NVH Director. Pls find the below image. I have to check in Hyperview Modal participation director
<?xml version="1.0" encoding="UTF-8"?>
Hi Arul,
You need to convert the punch file to .res file which can be used as result file.
If you are looking at outputting the panel contributions, calculation and output of the contribution from each panel at specific loading frequencies can be requested through the PFPANEL I/O Option, for modal frequency response. Also, the calculation and output of the contribution from each grid at the interface can be requested through the PFGRID I/O Option In addition to this, a file *.pfmode.pch is generated based on the definition of the I/O Options PFMODE, PFPANEL. The output for PFGRID would be in a H3D file. The results for PFMODE (for modal participation factors) and PFPANEL are best plotted in HyperGraph, whereas the contour results for PFGRID are best visualized in HyperView. I hope this helps. Feel free to contact us if you have any other questions.
Thanks for your help. I will check and get back
Rgds,
Arul
Hi Arul, You need to convert the punch file to .res file which can be used as result file. If you are looking at outputting the panel contributions, calculation and output of the contribution from each panel at specific loading frequencies can be requested through the PFPANEL I/O Option, for modal frequency response. Also, the calculation and output of the contribution from each grid at the interface can be requested through the PFGRID I/O Option In addition to this, a file *.pfmode.pch is generated based on the definition of the I/O Options PFMODE, PFPANEL. The output for PFGRID would be in a H3D file. The results for PFMODE (for modal participation factors) and PFPANEL are best plotted in HyperGraph, whereas the contour results for PFGRID are best visualized in HyperView. I hope this helps. Feel free to contact us if you have any other questions.
Hi.
How Do i do to export elements from pfgrid results? I need export elements display like as currente value: 0.3 and legend max:0.5. Results between 0.3 and 0.5 only.