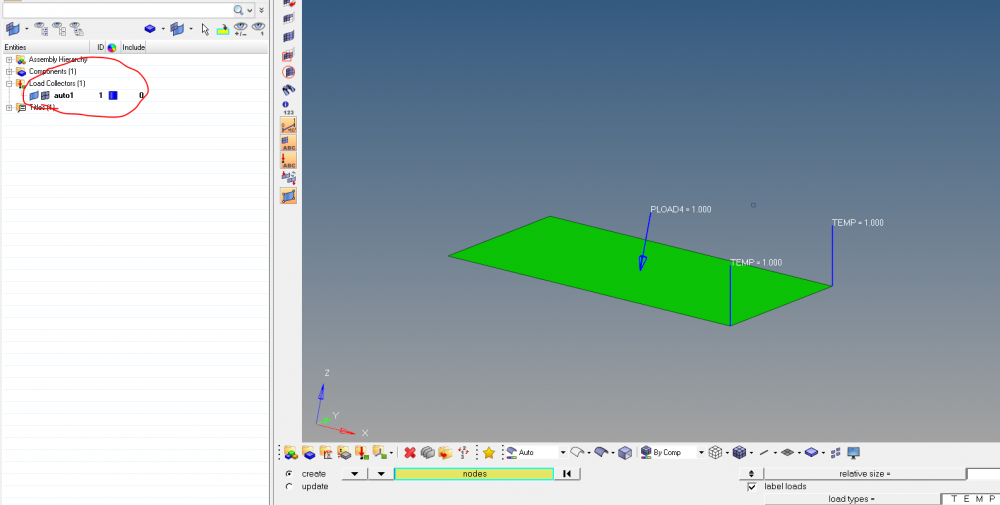
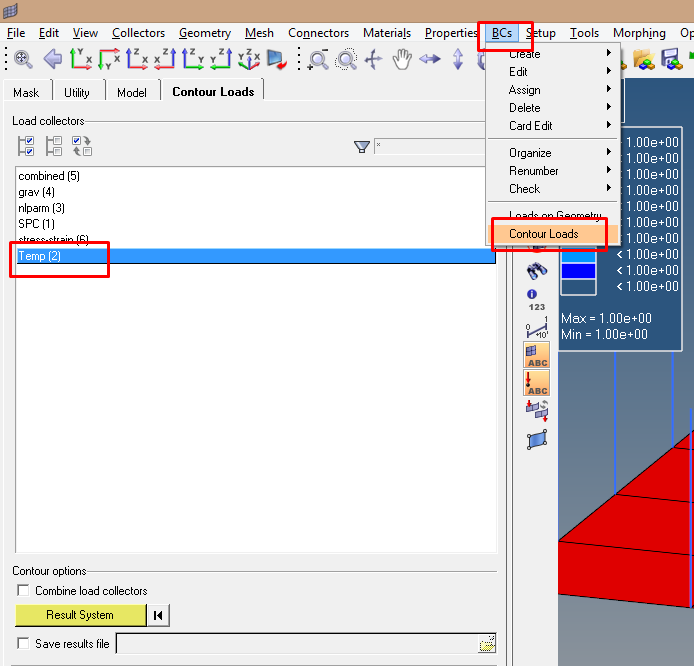
Hi , I have large amount of nodal temperature loads applied on the model. Is there any way to visualize the temperature load using contour plots in hypermesh.
Also , incase of PLOAD cards applied on the elements. Can we visualize applied pressure in hypermesh using contour plots?
Thanks in advance.
Girish