Hello community,
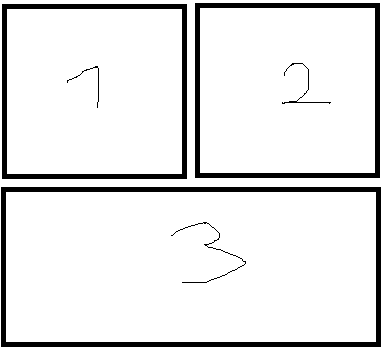
I would like to create a subplot that spans multiple grid positions.
I tried it as following but its only possible to hand over scalar values to the subplot function
subplot(2,2,1)
plot(x,y)
subplot(2,2,2)
plot(x,y)
subplot(2,2,3:4) <----- thats the issue
plot(x,y)
Best regards,
Nils
<?xml version="1.0" encoding="UTF-8"?>